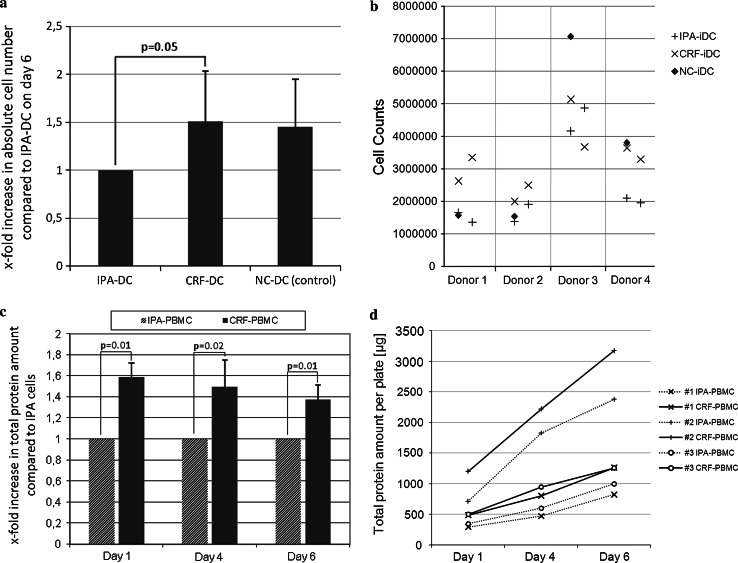
Fig. 2.
a Cell counts of immature DC on day 6, using a Neubauer counting chamber. The observer was blinded to the cryopreservation protocol used. Cell numbers are shown in relation to IPA-DC (set to 1.0 for each individual experiment). b Underlying original data of (a) as scatter graph: Four individual donors were analyzed (n = 4 for NC-DC). Two independent experiments of each donor’s IPA- and CRF-cryopreserved PBMC were performed (n = 8 for IPA-DC and n = 8 for CRF-DC). c Total protein per plate on day 1, 4, and 6 of cell culture after cryopreservation by IPA or CRF (Bradford protein assay, n = 3 different donors). CRF-PBMC protein amounts are shown in relation to IPA-PBMC protein amounts (set to 1.0 for each individual experiment). d Underlying original data of (c) shows total protein amounts per plate (μg) on day 1, 4, and 6. IPA-cells are depicted using a dotted line whereas CRF-cells are shown with continuous lines. Each of the markers “+, x, and o” indicate results of the same donor (n = 3 different donors)

