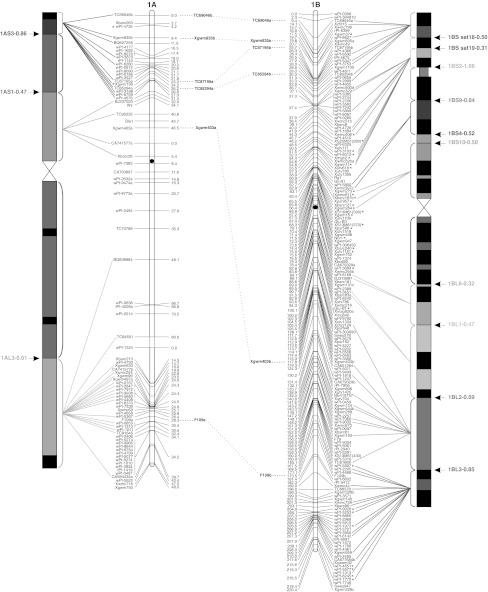
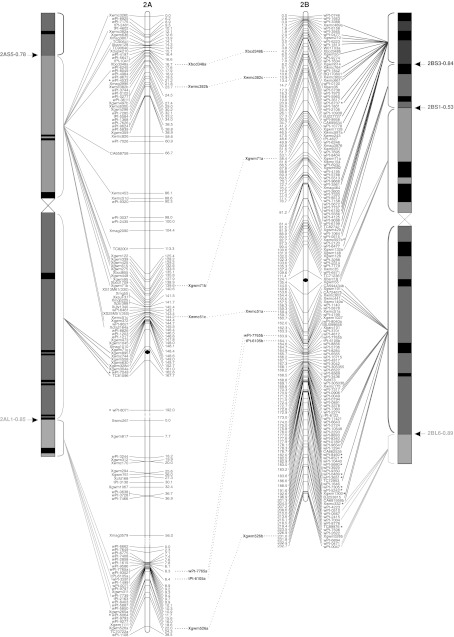
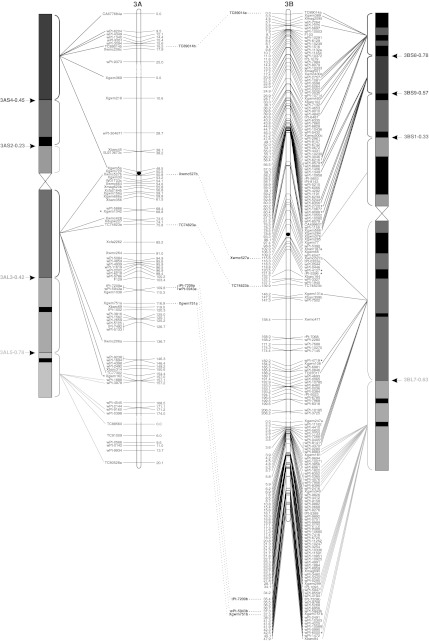
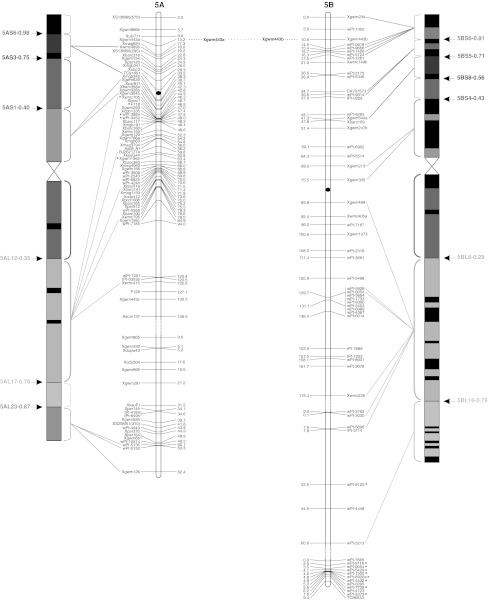
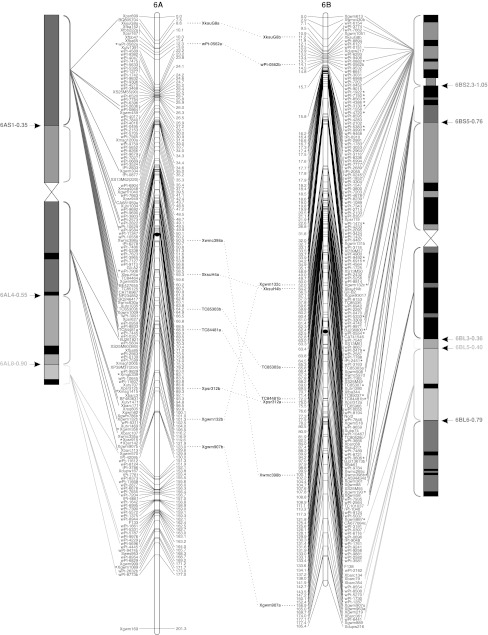
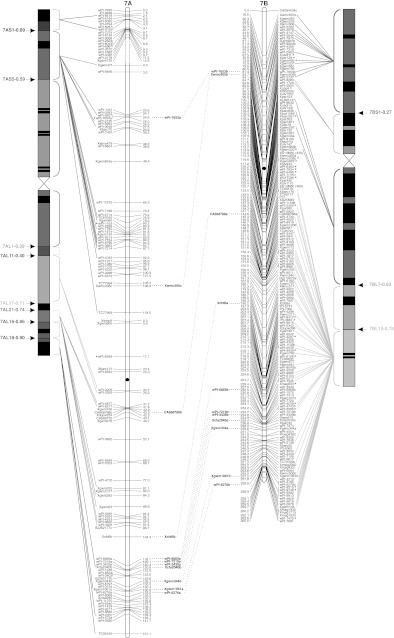
Fig. 1.
The durum wheat consensus linkage map. The deletion bin map as reported by Gadaleta et al. (2009) was aligned with the consensus map and the colored lines show the genetic/physical relationships for each marker. Straight lines connect markers to specific bins, characterized by different colors. Dotted lines connect homoeologous loci that are reported between the two chromosomes of each pair. Markers with segregation distortion (P < 0.01) are marked with an asterisk. Markers identifying two or more mapped loci have the suffix “.a”, “.b”, and so on. The centromeres are indicated by black circles. Dashed lines on chromosomes indicate break points (color figure online)

