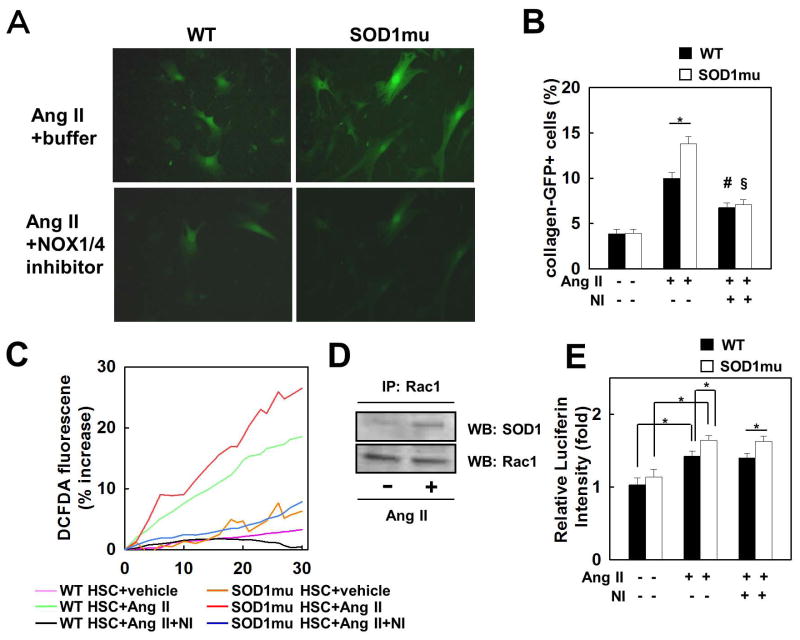
Fig. 6. Increased fibrogenic response and ROS production stimulated by Ang II in SOD1mu HSCs are suppressed by NOX1/4 inhibition.
HSCs isolated from WT and SOD1mu colI-GFP transgenic mice were stimulated by Ang II (10−6 M), with NOX1/4 inhibitor (20 μM), or vehicle for 24 hours (n=3). (A) Representative photomicrographs of GFP-positive HSCs and (B) their quantification are shown (original magnification ×200). *P<0.05, #P<0.05 compared to WT HSC stimulated by Ang II. §P<0.05 compared to SOD1mu HSC stimulated by Ang II. (C) HSCs from WT and SOD1mu mice were loaded with redox-sensitive dye CM-H2DCFDA (10 μM) for 20 minutes. Cells were then washed twice and subsequently stimulated by Ang II (10−6 M) with NOX1/4 inhibitor (20 μM) or vehicle. Fluorescence signals were quantified continuously for 30 minutes using fluorometer (n=3). (D) Rac1 immunoprecipitation (IP) from cell extracts from human HSC LX-2 cell line followed by Western blot (WB) for SOD1 or Rac1. (E) WT or SOD1mu HSCs were stimulated by Ang II with NOX1/4 inhibitor (20 μM) or vehicle for 24 hours. Rac1 activity was measured by ELISA (n=3). Ang II: angiotensin II, NI: NOX1/4 inhibitor. *P<0.05.

