Table 4.
Association of baseline estrogen metabolite levels with breast cancer risk by ER/PR status among women in the WHI Hormone Trials
| Estrogen receptor (ER) Progesterone Receptor (PR) Status | |||||||||
|---|---|---|---|---|---|---|---|---|---|
| ER+/PR+ | ER-/PRN | ||||||||
| N case/ control |
Median (IQR) | OR (95% CI) | p | N Case/ Control |
Median (IQR) | OR (95% CI) | p | ||
| 16α-OHE1(pg/ml) | 16α-OHE1(pg/ml) | ||||||||
| Quartile 1a | 78/423 | 239.5 (212.3-257.5) |
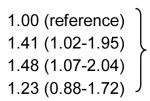
|
0.09d | Quartile 1a | 18/423 | 238.8 (211.0, 257.0) |
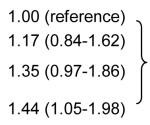
|
0.86d |
| Quartile 2a | 109/420 | 309.5 (291.0-327.0) | Quartile 2a | 23/420 | 309.5 (291.0, 326.5) | ||||
| Quartile 3a | 115/425 | 378.0 (358.0-398.0) | Quartile 3a | 20/425 | 377.5 (359.0, 398.0) | ||||
| Quartile 4a | 97/422 | 492.0 (450.5-570.0) | Quartile 4a | 17/422 | 491.5 (450.5, 569.0) | ||||
| Continuousa | 1.23 (0.87-1.74) | 0.24 | Continuousa | 0.75 (0.36-1.59) | 0.46 | ||||
| Continuousb | 1.12 (0.79-1.59) | 0.53 | Continuousb | 0.75 (0.35-1.58) | 0.44 | ||||
| Continuousc | 1.17 (0.82-1.67) | 0.40 | Continuousc | 0.77 (0.36-1.64) | 0.50 | ||||
|
| |||||||||
| 2-OHE1(pg/ml) | 2-OHE1(pg/ml) | ||||||||
| Quartile 1a | 86/428 | 60.0 (49.0, 69.0) |
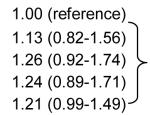
|
0.12d | Quartile 1a | 17/428 | 59.5 (48.5, 69.0) |
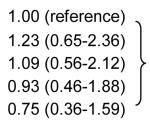
|
0.35d |
| Quartile 2a | 94/420 | 88.5 (82.0, 93.5) | Quartile 2a | 25/420 | 88.5 (82.0, 93.5) | ||||
| Quartile 3a | 105/419 | 116.0 (107.5, 125.0) |
Quartile 3a | 15/419 | 115.5 (107.3, 125.0) | ||||
| Quartile 4a | 114/423 | 174.5 (151.5, 227.0) |
Quartile 4a | 21/423 | 174.0 (153.0, 228.5) | ||||
| Continuousa | 1.35 (1.09-1.68) | 0.006 | Continuousa | 1.15 (0.75-1.76) | 0.54 | ||||
| Continuousb | 1.34 (1.08-1.66) | 0.008 | Continuousb | 1.12 (0.73-1.73) | 0.60 | ||||
|
| |||||||||
| Continuousc | 1.31 (1.05-1.63) | 0.02 | Continuousc | 1.13 (0.72-1.75) | 0.60 | ||||
| 2:16 ratio | 2:16 ratio | ||||||||
| Quartile 1a | 87/420 | 0.17 (0.13-0.19) |
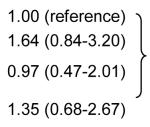
|
0.48d | Quartile 1a | 24/420 | 0.17 (0.13-0.19) |
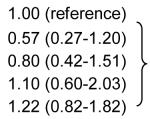
|
0.31d |
| Quartile 2a | 99/422 | 0.26 (0.24-0.28) | Quartile 2a | 11/422 | 0.26 (0.24-0.28) | ||||
| Quartile 3a | 107/422 | 0.35 (0.32-0.38) | Quartile 3a | 19/422 | 0.35 (0.33-0.38) | ||||
| Quartile 4a | 102/421 | 0.53 (0.47-0.67) | Quartile 4a | 24/421 | 0.53 (0.47-0.67) | ||||
| Continuousa | 1.21 (0.99-1.49) | 0.06 | Continuousa | 1.22 (0.82-1.82) | 0.33 | ||||
| Continuousb | 1.24 (1.01-1.53)e | 0.04 | Continuousb | 1.20 (0.81-1.79) | 0.37 | ||||
| Continuousc | 1.20 (0.98-1.49) | 0.08 | Continuousc | 1.20 (0.79-1.81) | 0.39 | ||||
All models account for age and ethnicity matching. Estrogen metabolite levels are log-transformed for continuous models.
Unadjusted
Adjusted for BMI
Adjusted for BMI and treatment arm
p-value for Wald Χ2 test for differences among quartiles
IQR=interquartile range
OR=odds ratio
CI=confidence interval
