Table 6.
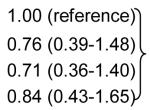
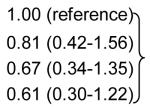
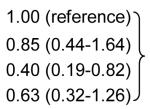
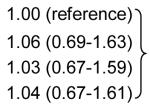
Association between 1-year HT-induced change in estrogen metabolites and breast cancer risk among study participants randomized to active treatment, stratified by WHI Hormone Trials (E-alone vs. E+P)
| N Cases/Controlsa |
Median (IQR) | OR (95% CI) | p | ||
|---|---|---|---|---|---|
| Change in 16α-OHE1 (pg/ml) | |||||
| E-alone | Quartile 1b | 32/80 | −36.0 (−64.5, −14.0) |

|
0.77e |
| Quartile 2b | 29/82 | 28.0 (8.0, 36.0) | |||
| Quartile 3b | 22/81 | 66.0 (55.0, 81.0) | |||
| Quartile 4b | 24/80 | 152.8 (117.8, 204.3) | |||
| Continuousb | 0.34 (0.008-13.8) | 0.57 | |||
| Continuousc | 0.42 (0.01-17.66) | 0.65 | |||
| Continuousd | 0.06 (0.00, 7.46) | 0.26 | |||
|
| |||||
| E+P | Quartile 1b | 74/122 | −20.0(−45.5, −2.5) |

|
0.45e |
| Quartile 2b | 69/123 | 32.8 (23.0, 45.1) | |||
| Quartile 3b | 85/125 | 87.0 (73.0, 104.4) | |||
| Quartile 4b | 65/120 | 185.0 (149.5, 240.0) | |||
| Continuousb | 0.39 (0.07-2.08) | 0.27 | |||
| Continuousc | 0.48 (0.09-2.40) | 0.37 | |||
| Continuousd | 0.38 (0.06, 2.27) | 0.29 | |||
|
| |||||
| Change in 2-OHE1 (pg/ml) | |||||
| E-alone | Quartile 1b | 32/80 | 18.5 (−8.6, 93.8) |

|
0.52e |
| Quartile 2b | 29/81 | 220.1 (181.5, 252.0) | |||
| Quartile 3b | 27/81 | 344.8 (313.7, 389.5) | |||
| Quartile 4b | 20/81 | 606.0 (503.5, 725.5) | |||
| Continuousb | 0.69 (0.18-2.64) | 0.58 | |||
| Continuousc | 0.70 (0.18-2.77) | 0.62 | |||
| Continuousd | 0.10 (0.00, 3.03) | 0.26 | |||
|
| |||||
| E+P | Quartile 1b | 69/122 | 17.0 (−10.7, 85.5) |

|
0.71e |
| Quartile 2b | 85/123 | 228.0 (182.3, 272.0) | |||
| Quartile 3b | 71/121 | 372.0 (340.0, 415.8) | |||
| Quartile 4b | 68/123f | 582.5 (506.0, 738.7) | |||
| Continuousb | 0.88 (0.50-1.54) | 0.65 | |||
| Continuousc | 1.02 (0.57-1.84) | 0.94 | |||
| Continuousd | 0.72 (0.35, 1.49) | 0.37 | |||
|
| |||||
| Change in 2:16 ratio | |||||
| E-alone | Quartile 1b | 32/81 | 0.08 (−0.02, 0.17) |

|
0.07e |
| Quartile 2b | 34/80 | 0.49 (0.40, 0.59) | |||
| Quartile 3b | 18/81 | 0.87 (0.77, 0.96) | |||
| Quartile 4b | 23/81 | 1.38 (1.20,1.70) | |||
| Continuousb | 0.57 (0.08-3.90) | 0.57 | |||
| Continuousc | 0.59 (0.08-4.17) | 0.59 | |||
| Continuousd | 0.07 (0.00, 6.56) | 0.25 | |||
|
| |||||
| E+P | Quartile 1b | 71/123 | 0.04 (−0.03-0.14) |

|
0.99e |
| Quartile 2b | 73/122 | 0.46 (0.37-0.54) | |||
| Quartile 3b | 73/122 | 0.83 (0.75-0.95) | |||
| Quartile 4b | 75/122 | 1.38 (1.21-1.74) | |||
| Continuousb | 1.01 (0.36-2.86) | 0.99 | |||
| Continuousc | 1.41 (0.47-4.23) | 0.54 | |||
| Continuousd | 0.60 (0.11, 3.38) | 0.56 | |||
1-year changes assessed only among those assigned to active treatment, not those assigned to placebo. All models account for age and ethnicity-matching. For continuous models, change in estrogen metabolite levels are log-transformed (after adding a constant).
n’s differ from total due to missing values: 16-OHE-1 (1 case and 1 control), 2-OHE-1 (1 control, and 2:16 ratio (2 cases, 1 control)
Unadjusted
Adjusted for BMI
Adjusted for ln-transformed baseline levels
p-value for Wald Χ2 test for differences among quartiles. HT= hormone therapy
IQR=interquartile range
OR=odds ratio
CI=confidence interval
