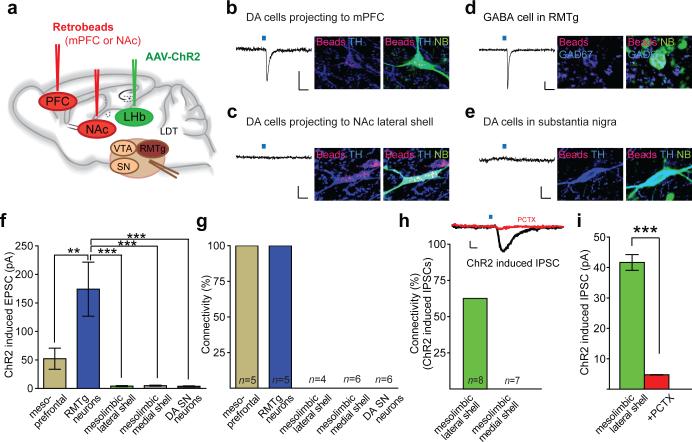
Figure 4. LHb neurons preferentially synapse on DA neurons projecting to mPFC and RMTg GABAergic neurons.
a, AAV-ChR2-EYFP injected into LHb and retrobeads injected either into NAc lateral shell and NAc medial shell or in mPFC. b-e, Traces from whole-cell recordings at -70 mV showing EPSCs generated by optical stimulation of LHb inputs in retrogradely labeled VTA neurons (beads, red) projecting to (b) mPFC or (c) NAc lateral shell or (d) an RMTg cell and (e) SN cell. All cells were filled with neurobiotin (NB, green) and are either TH-immunopositive (blue) (b, c, e) or GAD67-immunopositive (blue, d). Scale bars: 20 pA/20 ms. f, Summary of average EPSCs generated by optical stimulation of LHb inputs in five cell populations ( **p<0.01, ***p<0.001, 1 way ANOVA with Bonferroni post-hoc test, error bars denote s.e.m.). g, Percentage of cells in which optical stimulation generated EPSCs >10 pA. N's shown in this graph also apply to f. h, Optical stimulation of LHb inputs generates IPSC in DA cell projecting to NAc lateral shell (PCTX, picrotoxin) (scale bars, 20 pA/20 ms). Graph shows percentage of DA cells projecting to NAc lateral shell or medial shell in which IPSCs were generated by LHb input stimulation. i, Average IPSC size from DA cells projecting to NAc lateral shell. IPSCs were blocked by picrotoxin (n=3; ***p<0.0001, unpaired Student's t-test).

