Figure 1.
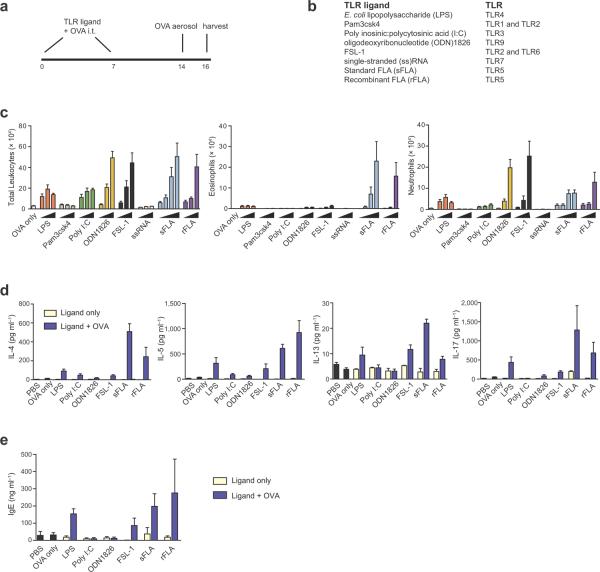
Adjuvant activity of microbial products in the airway. (a) Timeline for sensitizations and challenges. (b) Microbial products used, and the TLRs that mediate signaling responses to each product. (c) Airway inflammation in sensitized mice and challenged mice: Cell number ± s.e.m. in BALF of total leukocytes (left), eosinophils (middle) and neutrophils (right).  , increasing amounts (25 ng, 125 ng or 625 ng) of microbial product used during sensitizations; sFLA also includes 1250 ng. n = 5 – 8 mice per group. (d) Pulmonary cytokines: left to right, IL-4, IL-5, IL-13 and IL-17. (e) Total serum IgE. Data are from one of three similar experiments. n = 5 – 8 mice per group. nd, not detected.

