Figure 2.

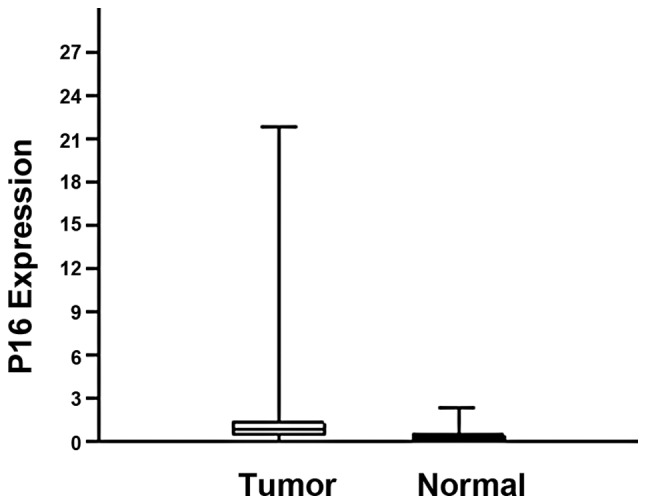
Expression of the p16INK4 gene in the tumors and normal tissue. The vertical axis indicates the normalized fluorescence signal. The boxes indicate the upper and lower quartiles.

Expression of the p16INK4 gene in the tumors and normal tissue. The vertical axis indicates the normalized fluorescence signal. The boxes indicate the upper and lower quartiles.