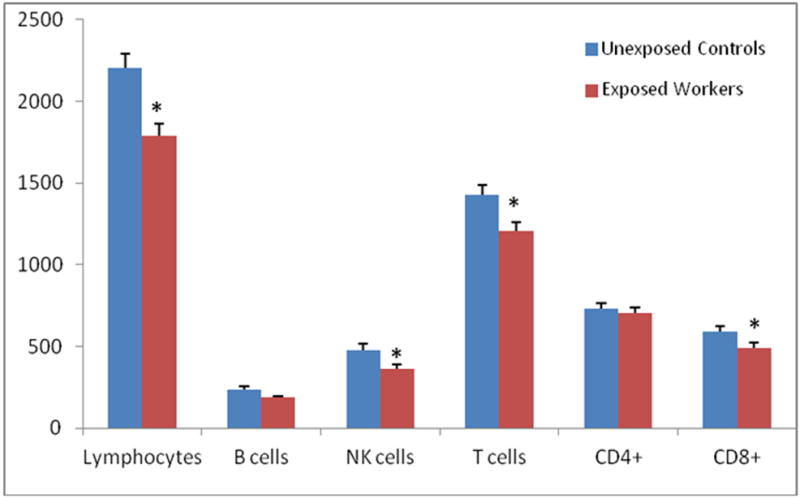
Figure 1.

Lymphocyte and major lymphocyte subset counts (mean ± standard error) among formaldehyde exposed workers and unexposed controls†.
†Results for total lymphocyte counts previously reported in (Zhang L, 2010). Lymphocytes and lymphocyte subset counts in relation to formaldehyde exposure. Differences in cell counts were tested by linear regression analysis of ln-transformed end point, adjusting for relevant covariates as described in the methods section; *P < 0.05.
