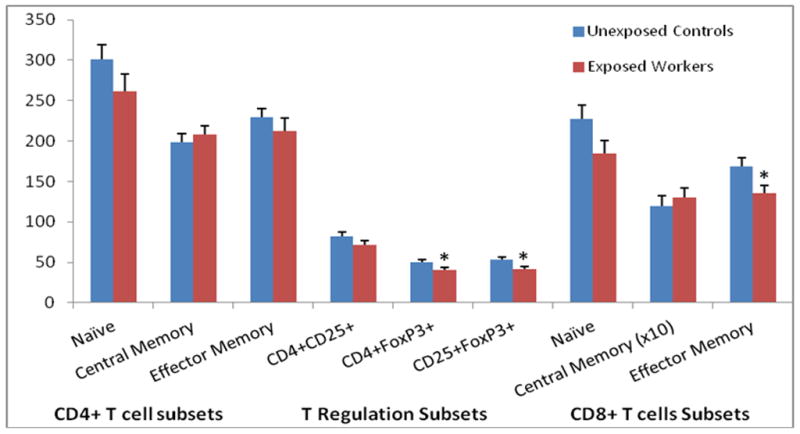
Figure 2.

T cell subset counts (mean ± standard error) among formaldehyde exposed workers and unexposed controls†.
† T cell lymphocyte subset counts in relation to formaldehyde exposure. Differences in cell counts were tested by linear regression analysis of l n-transformed end point, adjusting for relevant covariates as described in the methods section; *P < 0.05.
