Figure 3.
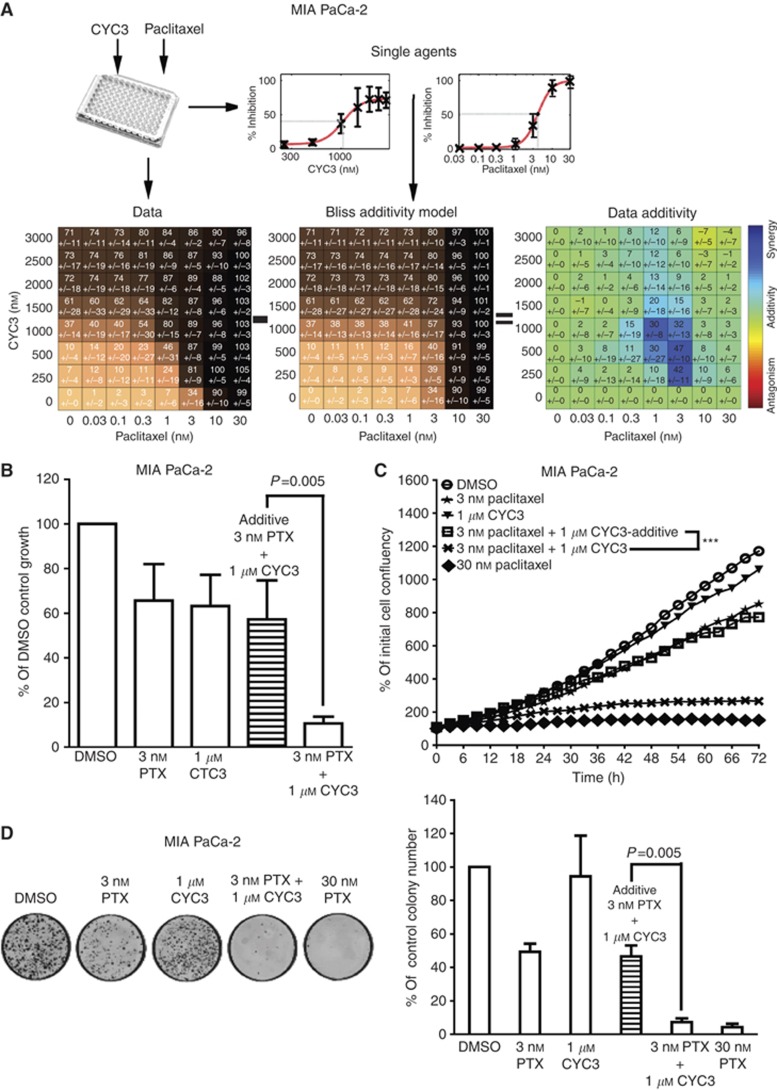
Evaluation of the effect of paclitaxel and CYC3 in combination. (A) MIA PaCa-2 cells were seeded in 96-well plates and treated with an 8 × 8 combinations of CYC3 and paclitaxel for 72 h. The experimental data (mean of 6 replicates, left), the predicted inhibition by Bliss additivity model based on single-agent data (middle) and the difference value (Data additivity, right) tables are presented. The Synergy spots are in blue in the ‘Data additivity’ table. (B) Statistical analysis of the combination of 3 nℳ paclitaxel and 1 μℳ CYC3 in cells using SRB assays. Error bars represent the s.d. (C) Time-lapse microscopic measurement of the cell growth with CYC3 and paclitaxel as indicated. The predicted growth curve induced by additive suppression with 3 nℳ paclitaxel and 1 μℳ CYC3 is presented. These data are the mean of three replicates. ***Interaction P<0.0001, treatment difference P=0.0007. (D) Cells were incubated with paclitaxel and/or CYC3 for 72 h, then plated in colony-forming assays. The left panels are the photos of the colony plates and the right panels are the quantification of the plates using ImageQuantTL. The predicted colony numbers induced by additive suppression with 3 nℳ paclitaxel and 1 μℳ CYC3 are presented. These data are the mean of six replicates.

