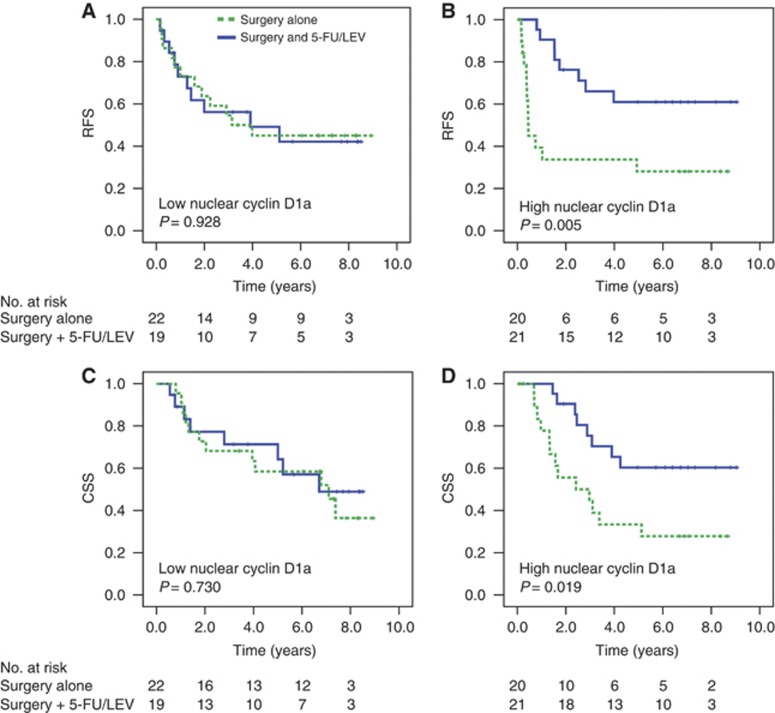
Figure 3.
Colon stage III patients and treatment response according to nuclear cyclin D1a expression. Curves are generated by the Kaplan–Meier method and P-values are from the log-rank test. Treatment response are measured in RFS (A and B) and CSS (C and D) for low (A and C) vs high (B and D) expression of nuclear cyclin D1a. Green curves represent patients treated with surgery alone and blue patients treated with surgery plus adjuvant therapy (5-FU/LEV). Abbreviations: CSS=cancer specific survival; RFS=relapse-free survival.

