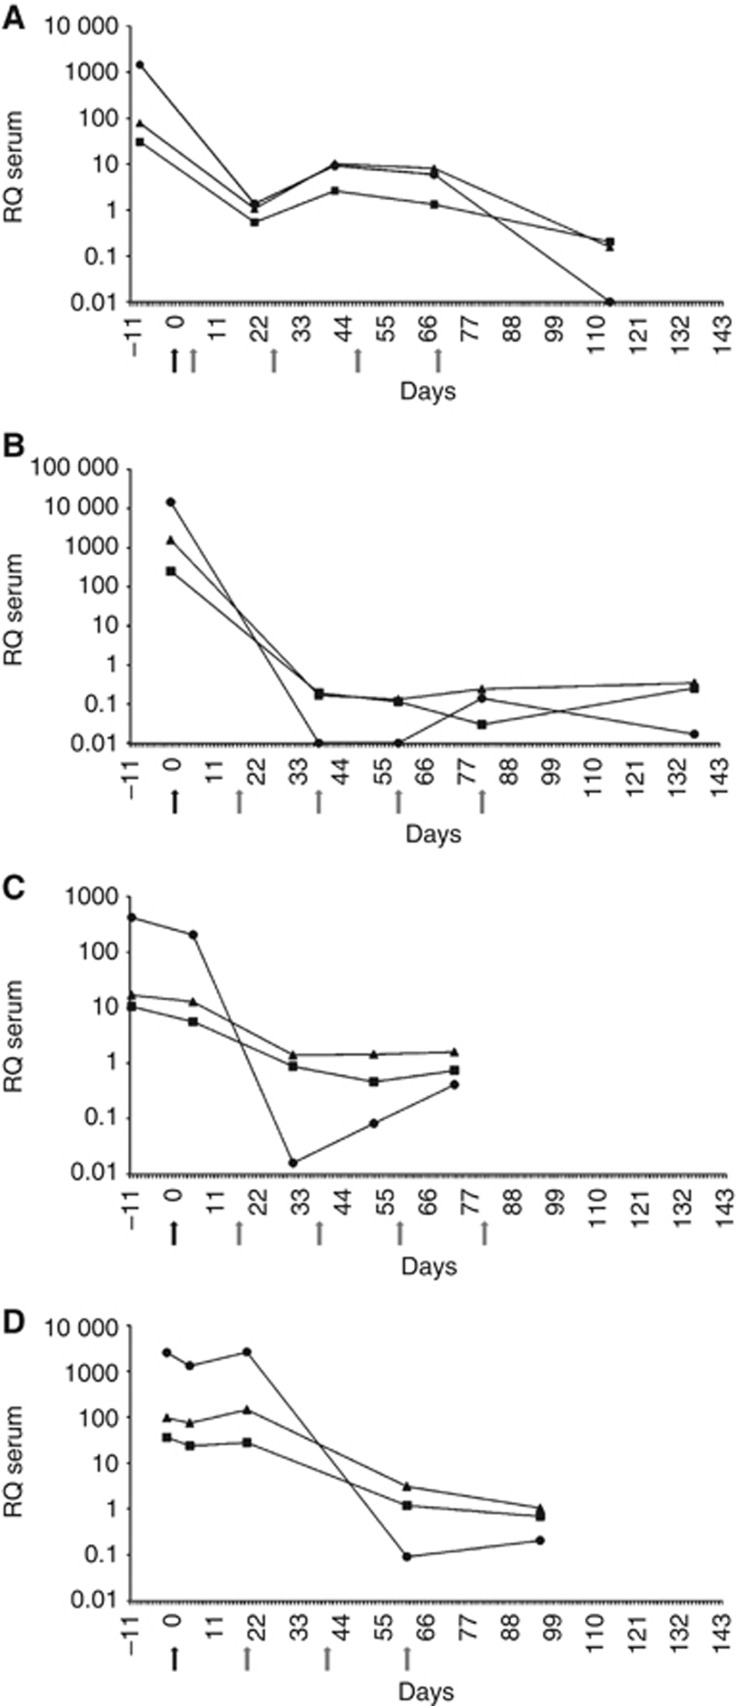
Figure 4.
(A–D) Results of miR-371-3 quantification in four GCT patients with nonseminoma clinical stage 3 (A, B), stage 2a (C), and stage 2b (D), respectively. Serial measurements of miR-371-3 expression in serum from time of diagnosis to completion of chemotherapy.  : miR-371a-3p.
  : miR-372.
  : miR-373-3p. The y axis is plotted on a log10 scale. Black arrow indicates the timing of surgery of the primary tumour and grey arrows indicate the timing of chemotherapy cycles.

