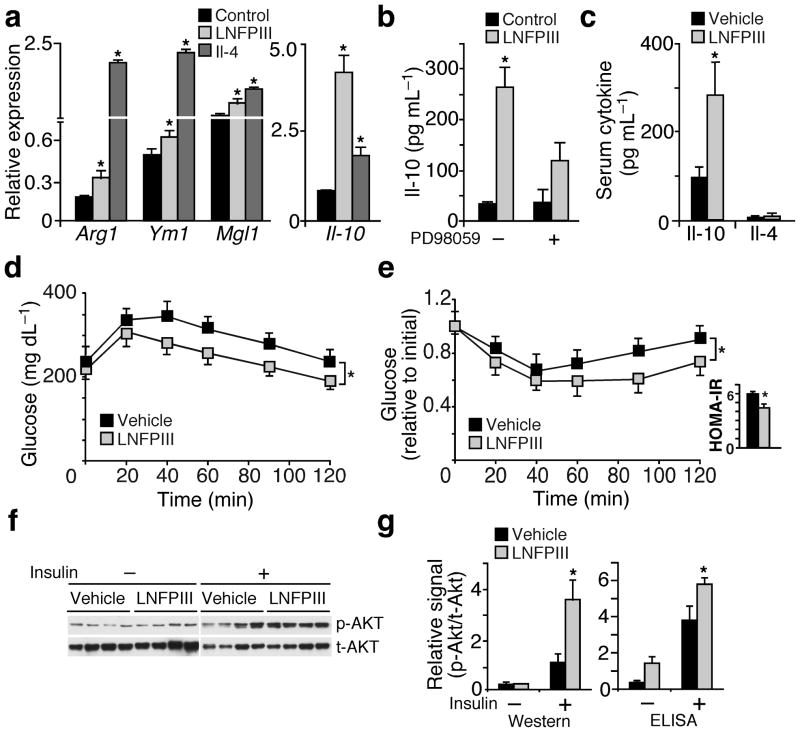
Figure 1.
LNFPIII increases Il-10 production and improves insulin sensitivity. (a) Real-time q-PCR examining the expression of M2 (alternative activation) genes in bone marrow derived macrophages treated with Il-4 (20 ng ml−1) or LNFPIII (20 μg ml−1) for 24 hr. (b) Il-10 concentrations in conditioned medium from LNFPIII or vehicle treated macrophages determined by ELISA. PD98059 (10 μM): Erk inhibitor. (c) Serum Il-10 and Il-4 concentrations in vehicle or LNFPIII treated mice (n = 5–7 per treatment) (d and e) Glucose tolerance test (GTT, d) and insulin tolerance test (ITT, e) in vehicle and LNFPIII treated mice. Inset in (e): homeostasis model of assessment-insulin resistance (HOMA-IR). (f) Western blot analyses to examine insulin stimulated Akt phosphorylation in WAT from vehicle and LNFPIII treated mice (from four individual mice per treatment). p-Akt: phospho-Akt; t-Akt: total Akt. (g) The relative level of p-Akt to t-Akt in WAT ±insulin injection quantified by densitometry based on Western signals in (f) or by ELISA-based assays. Values are expressed as means ± SEM. For in vitro assays, the mean and SEM were determined from 3–4 biological replicates for a representative experiment. Experiments were repeated 3 times. In vivo studies were reproduced in three mouse cohorts (n = 5–7 per treatment). Insulin signaling was examined in two of the three cohorts. *P < 0.05 (LNFPIII or Il-4 versus vehicle control).

