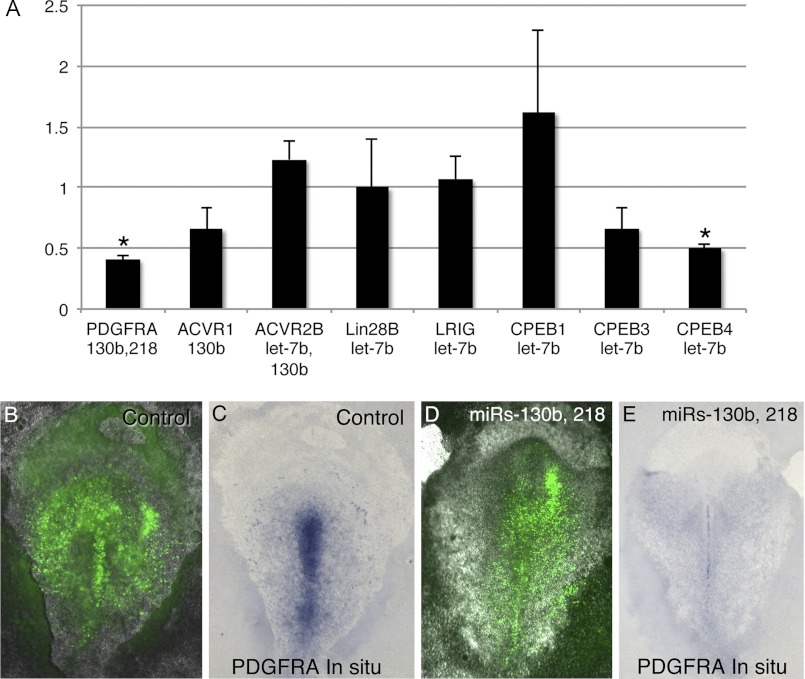
FIGURE 6.
PDGFRA and CPEB4 mRNAs are targeted for degradation by miRs in vivo. A, real-time PCR analysis comparing mRNA levels of predicted miR targets in samples from primitive streak regions of embryos electroporated with a control miR (cel-167) versus embryos electroporated with miR-let-7b, -130b, and/or -218. Asterisks indicate changes in mRNA levels that are statistically significant (p < 0.05). Error bars indicate S.E. B–E, visualization of PDGFRA mRNA reduction in embryos by overexpression of miRs. B and C, images showing the same embryo electroporated with a control miR mimic (cel-167) or with mimics for miR-130b and -218, visualizing the location of miR mimics (green fluorescence in B and D) and PDGFRA mRNAs by ISH (C and E). Introduction of miR-130b and -218 leads to a reduction of PDGFRA mRNAs in the primitive streak.

