FIGURE 3.
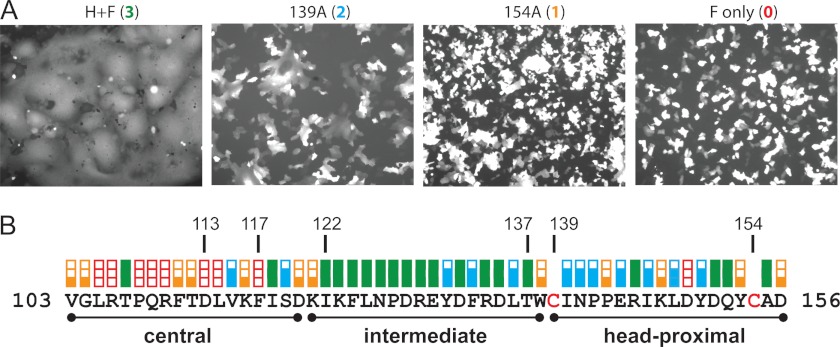
Fusion-support function of H-stalk mutants. A, examples of visual assessment of syncytium formation. Vero cells were co-transfected with an F-expression plasmid, a standard or mutated H-expression plasmid and a GFP-expression plasmid. The fusion score was determined 24-hours post transfection. Fusion score of 3 (left panel) was observed after expression of wild-type proteins. Fusion scores of 2 (second panel) and 1 (third panel) were observed after co-expression of the mutant H-proteins indicated with wild-type F-protein. A 0 fusion score was documented in a control transfected without the H-expression plasmid (fourth panel). The parameters (number of nuclei per syncytium) used to assess the level of fusion are indicated in the experimental procedures. B, fusion scores for all the Cys substitution mutants, in linear sequence. Red empty box, fusion score of zero; one-third filled orange box, fusion score of 1; two-thirds filled blue box, fusion score of 2; full green box, fusion score of 3. The central, intermediate and head-proximal segments are indicated by black lines.

