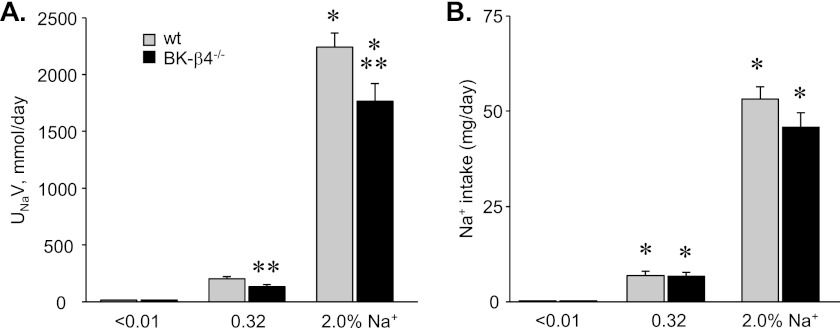
FIGURE 6.
Renal sodium excretion is impaired in BK-β4 null mice. A, shown is a summary graph of renal sodium excretion (UNaV) in wild type (gray; n = 10, 17, and 11) and BK-β4 null (black; n = 9, 6, and 6) mice maintained with nominally free, regular, and high sodium diets for 7 days. The excretion rate shown here is that for the final day of treatment. B, shown is a summary graph of sodium intake in wild type (gray; n ≥ 6) and BK-β4 null (black; n ≥ 6) mice maintained with nominally free, regular, and high sodium diets for 7 days. Average daily sodium intake shown here is for the final day of treatment. *, significant increase versus <0.01% Na+. **, significantly less compared with wild type on the same diet.

