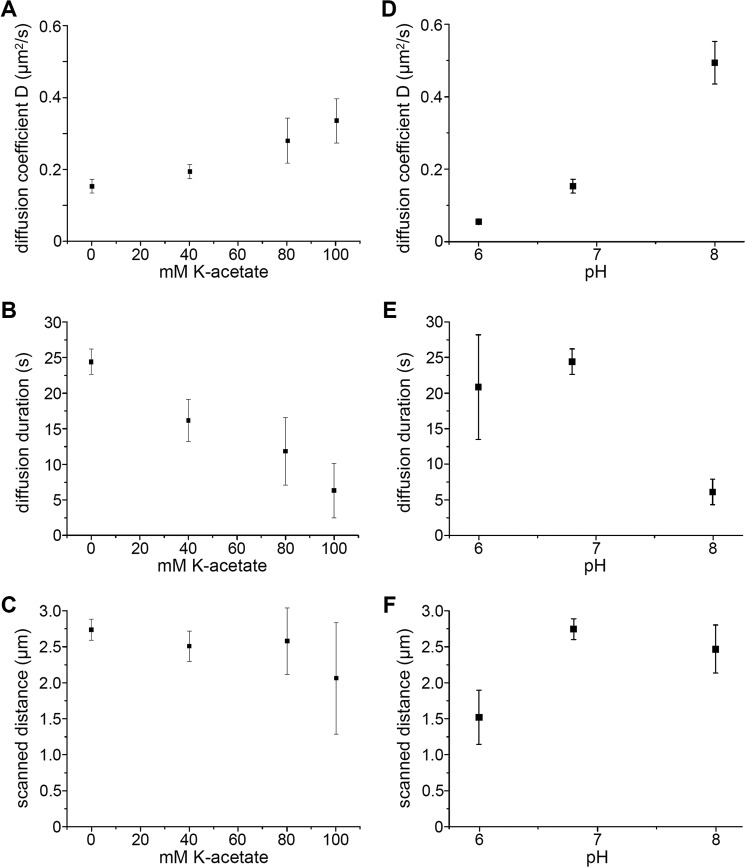
FIGURE 4.
The diffusion of Tau molecules along MTs is sensitive to ionic strength and pH. A, diffusion coefficient D of TMR-labeled hTau40 molecules diffusing along MTs versus potassium acetate concentration added to buffer BRB12 resulting in final ionic strength of ∼40, 80, 120, and 140 mm, respectively. Error bars represent error margins of the Gaussian fits. B, diffusion time, corrected for photobleaching, of TMR-labeled hTau40 molecules versus potassium acetate added to buffer BRB12. Error bars represent error margins of the exponential decay fits to the observed duration and the TMR fluorescence decay. C, MT sections scanned by hTau40-TMR molecules (calculated from the diffusions constants and the respective corrected interaction times) versus potassium acetate concentration. Error margins were calculated from the error margins in A and B. D, diffusion coefficient D of hTau40-TMR molecules diffusing along MTs versus pH of buffer BRB12. Error bars represent error margins of the Gaussian fits. E, photobleaching corrected diffusion time of hTau40-TMR molecules versus pH of buffer BRB12. Error bars represent error margins of the exponential decay fits to the observed duration and the TMR fluorescence decay. F, MT sections scanned by hTau40-TMR molecules versus pH of buffer BRB12 (calculated from the respective diffusions constants and interaction times). Error margins were calculated from the error margins in E and F.

