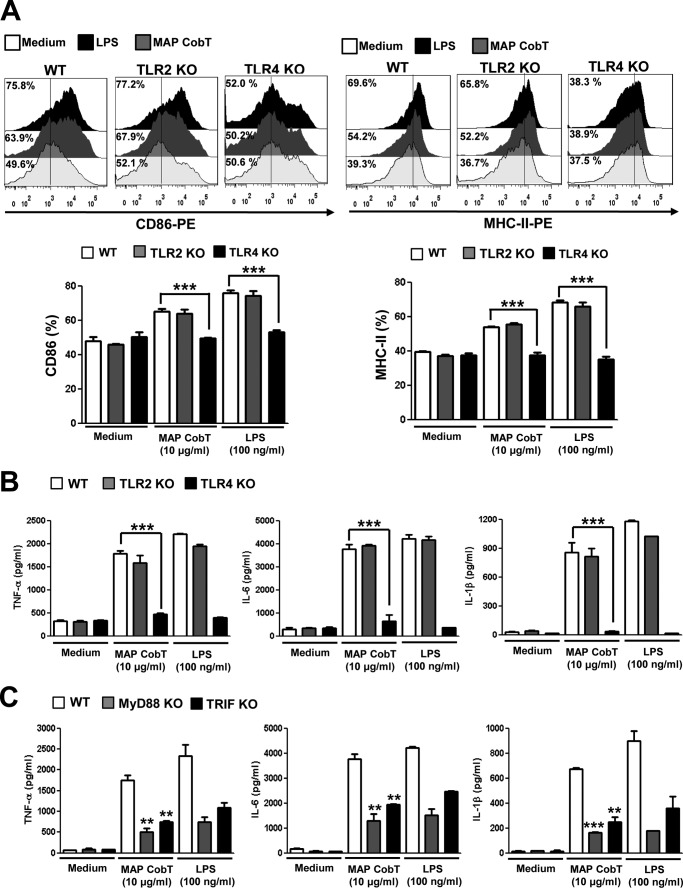
FIGURE 3.
MAP CobT induces activation of DCs via interaction with TLR4. A, histograms showing CD86 or MHCII expression on MAP CobT-treated CD11c+-gated DCs derived from WT, TLR2−/−, and TLR4−/− mice. DCs derived from WT, TLR2−/−, and TLR4−/− mice were treated for 24 h with MAP CobT (10 μg/ml). The percentage of positive cells is shown for each panel. Bar graphs show the mean ± S.E. of the percentages for each surface molecule on CD11c+ cells in three independent experiments. Statistical significance (***, p < 0.001) is indicated for MAP CobT-treated TLR4−/− versus MAP CobT-treated WT DCs. B, DCs derived from WT, TLR2−/−, and TLR4−/− mice were treated for 24 h with MAP CobT or LPS. TNF-α, IL-6, or IL-1β production was measured by ELISA. C, DCs derived from WT, MyD88−/−, and TRIF−/− mice were treated for 24 h with MAP CobT (10 μg/ml) and LPS (100 ng/ml). TNF-α, IL-6, or IL-1β production was measured by ELISA. All data are expressed as the mean ± S.E. (n = 3) and statistical significance (***, p < 0.001) is indicated for treatments as compared with MAP CobT-treated WT DCs.

