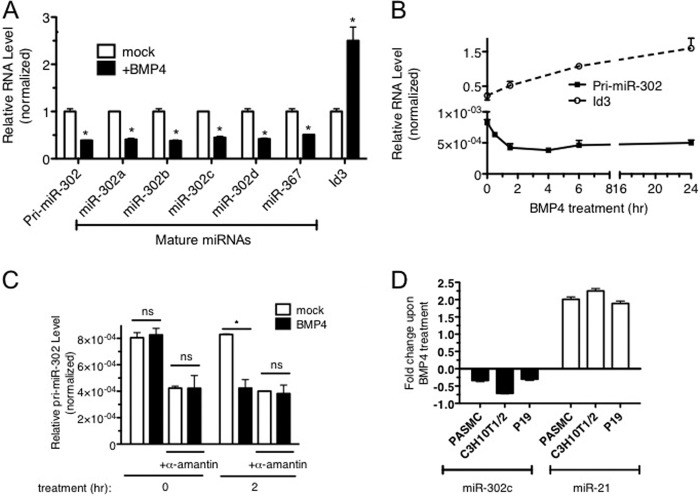
FIGURE 1.
Transcriptional regulation of miR-302∼367 cluster by BMP4. A, total RNAs were harvested from PASMCs treated with 3 nm BMP4 for 24 h and expression levels of pri-miR-302 or Id3 mRNA relative to GAPDH and mature miR-302a-d and miR-367 relative to U6 snRNA were measured by qRT-PCR. Data represent the expression levels in BMP4-stimulated cells relative to untreated cells in triplicates. *, p < 0.01. B, PASMCs were treated with 3 nm BMP4, and total RNAs were harvested at different time points. mRNA levels of pri-miR-302 and Id3 relative to GAPDH were measured by qRT-PCR in triplicates. Data represent mean ± S.E. C, PASMCs were treated with α-amanitin for 4 h prior to the stimulation with 3 nm BMP4 for 2 h. Level of pri-miR-302 relative to GAPDH was measured by qRT-PCR. Data represent mean ± S.E. *, p < 0.01. ns: statistically not significant. D, different types of cells, including PASMC, C3H10T1/2, and P19, were treated with 3 nm BMP for 24 h, and total RNAs were subjected to qRT-PCR analysis of miR-302c and miR-21 relative to U6 snRNA in triplicates. Data represent fold changes of the expression levels in BMP4-treated cells in comparison with untreated cells in triplicates. *, p < 0.01.

