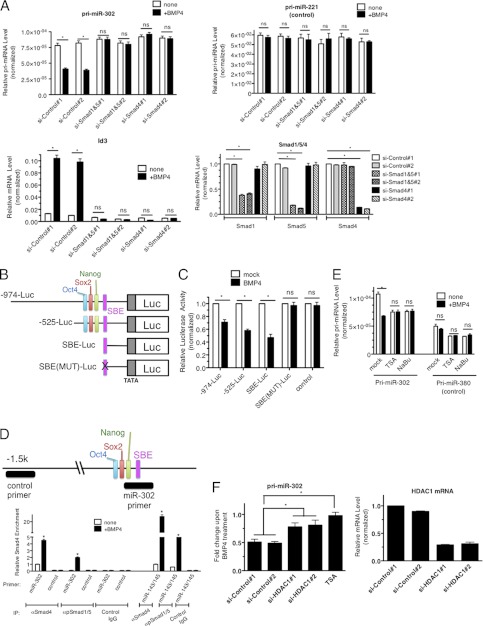
FIGURE 2.
Transcriptional repression of miR-302 by BMP4 is Smad-dependent. A, PASMCs were transfected with non-targeting control siRNAs (si-Control#1 and #2), mixture of siRNAs against Smad1 and Smad5 (si-Smad1&5#1 and #2) or Smad4 (si-Smad4#1 and #2), followed by 3 nm BMP stimulation for 24 h. Levels of pri-miR-302, pri-miR-221 (control), Id3, Smad1, Smad4, or Smad5 mRNAs relative to GAPDH were measured by qRT-PCR. Data represent mean ± S.E. *, p < 0.01. ns: statistically not significant. B, schematic diagram of luciferase reporter constructs containing human miR-302∼376 gene promoter region. C, Luciferase activity was examined in COS7 cells using the luciferase vector containing either long −974-Luc (−974-Luc) or short −525-Luc (−525-Luc). An empty luciferase vector (control) was used as a control. Relative luciferase activity of each construct with BMP4 stimulation relative to unstimulated are shown. Data represent mean ± S.E. *, p < 0.01. ns: statistically not significant. D, schematic diagram of the miR-302∼367 promoter region which is recognized by the control or miR-302 ChIP primer is indicated as a black bar. PASMCs were stimulated with BMP4 for 4 h and subjected to ChIP assay using anti-Smad4 antibody. qRT-PCR was then performed to measure enrichment of DNA fragment by primers, such as control, miR-302, or miR-143/145 promoter region. The data were plotted as relative enrichment to input. Error bars indicate S.E. *, p < 0.01. E, PASMCs were treated with HDAC inhibitors; TSA or NaBu prior to BMP4 stimulation and total RNAs were isolated. Levels of pri-miR-302 or pri-miR-380 relative to GAPDH were quantitated. Data represent mean ± S.E.; *, p < 0.01. ns: statistically not significant. F, PASMCs were transfected with control siRNA #1,2 or siRNA against HDAC1#1,2, followed by BMP4 treatment. Levels of pri-miR-302 and HDAC1 mRNA relative to GAPDH were quantitated. Data represent mean ± S.E. *, p < 0.01.

