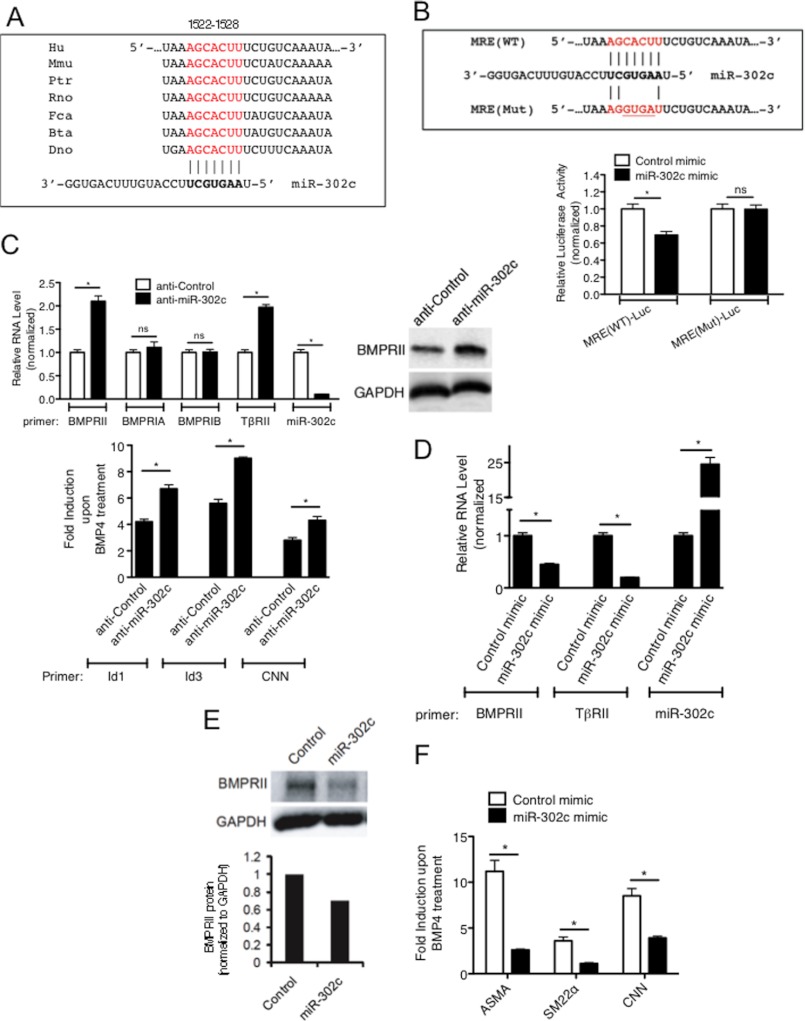
FIGURE 3.
miR-302 family targets BMPRII gene. A, miR-302 MRE sequence found in the 3′-UTR of BMPRII mRNA are conserved in different mammals. Hu: human, Mmu: mouse, Ptr: chimpanzee, Rno: rat, Fca: cat, Bta: cow, and Dno: armadillo. B, sequence of wild type miR-302 MRE [MRE(WT)] and mutated MRE [MRE(Mut)] cloned into the 3′-UTR of the luciferase gene is shown (upper panel). Luciferase activity was examined in COS7 cells transfected with MRE(WT)-Luc or MRE(Mut)-Luc with miR-302 mimic or control mimic. Luciferase activity with miR-302 mimic relative to the activity with control mimic is shown. C, PASMCs were transfected with 50 nm antisense against GFP (anti-Control) or anti-miR-302c, followed by BMP4 treatment. Levels of BMPRII, BMPRIA, BMPRIB, TβRII, Id1, Id3, or CNN mRNAs relative to GAPDH and miR-302c relative to U6 snRNA were quantitated by qRT-PCR analysis. Fold induction of Id1, Id3, or CNN mRNAs upon BMP4 treatment is plotted (bottom panel). Data represent mean ± S.E. of three independent experiments. *, p < 0.01. ns: statistically not significant. Total cell lysates were subjected to immunoblot analysis of endogenous BMPRII and GAPDH (loading control) (top right panel). D, PASMCs were transfected with 5 nm Control mimic or miR-302c mimic, followed by qRT-PCR expression analysis of BMPRII or TβRII mRNAs, relative to GAPDH and miR-302c relative to U6 snRNA. Data represent mean ± S.E.; *, p < 0.01. E, total cell lysates of PASMC transfected with 5 nm Control mimic or miR-302c mimic were subjected to immunoblot analysis of endogenous BMPRII and GAPDH (loading control). Relative intensity of the band of BMPRII and GAPDH protein are quantitated by ImageJ and shown at the bottom panel. F, PASMCs were transfected with Control mimic or miR-302c mimic, followed by qRT-PCR expression analysis to quantitate ASMA, SM22α, and CNN mRNAs relative to GAPDH.

