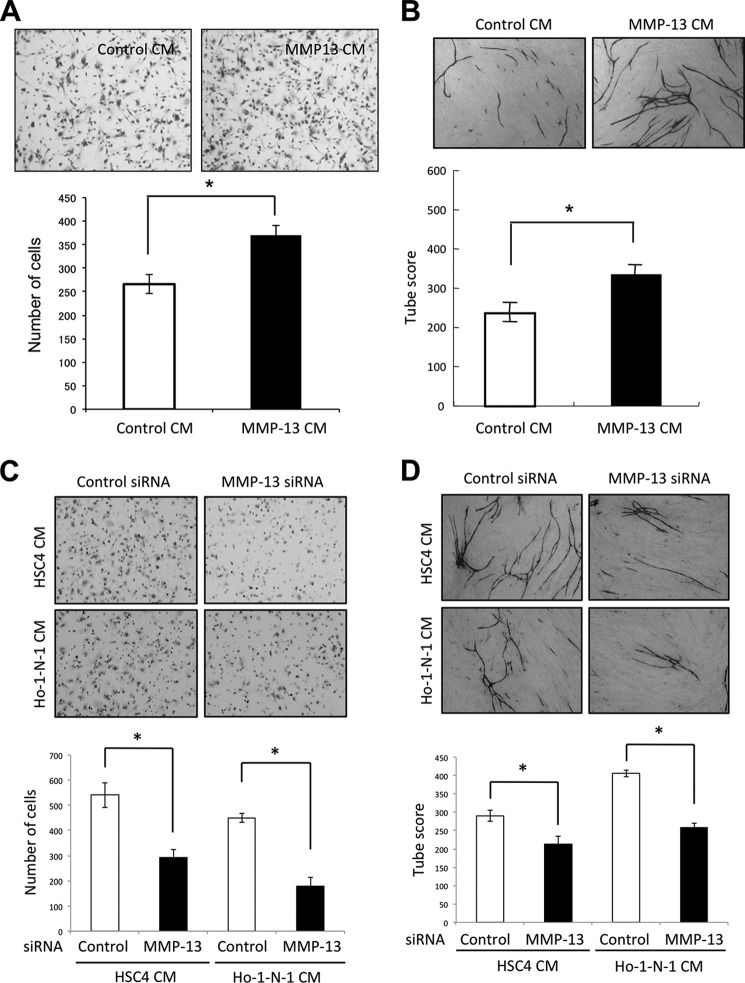
FIGURE 2.
Involvement of MMP-13 in migration and capillary tube formation of HUVECs. A, migration activity by conditioned medium from MMP-13-overexpressing cells. Migration activity was measured by the use of a 24-well cell culture insert with 8-μm pores. The lower compartment contained 0.5 ml of conditioned medium from empty vector-transfected HSC3 cells (control CM) or MMP-13-overexpressing HSC3 cells (MMP-13 CM). After trypsinization, 5 × 10⁴ of immortalized HUVECs (HuhT1) were resuspended in 100 μl of serum-free medium and placed in the upper compartment of the cell culture insert for 4 h. To examine the activity of migration, the cells that had penetrated onto the lower side of the filter were fixed with formalin and stained with hematoxylin. The upper panel shows the representative area of penetrated cells. The lower graph shows the average number of penetrated cells. The bars show the average values and S.D. of three independent experiments. *, significantly different from control at p < 0.05. B, upper panel shows the representative area of capillary tube formation by conditioned medium from empty vector-transfected HSC3 cells (control CM) or MMP-13-overexpressing HSC3 cells (MMP-13 CM) (×40). An angiogenesis assay kit was used according to the manufacturer's instructions with minor modifications. HUVECs were treated with mixture of conditioned medium and HuMedia-EG2 in a percentage of 1:1. The mixed media were changed every 3 days. After 12 days, the cells were fixed and stained with anti-human CD31 antibody as described under “Materials and Methods.” The lower graph shows the average capillary tube score after conditioned medium treatment. Capillary tube score was estimated with the Chalkley count method under a bright-field microscope. The values represent means of capillary tube score + S.D. based on three wells/data point in a single experiment. *, significantly different from control at p < 0.05. C, migration activity of HuhT1 cells by conditioned medium from control or MMP-13 siRNA-treated cells. MMP-13 siRNA were transfected into HSC4 and Ho-1-N-1 cells. Migration activity was measured as described in A. The upper panel shows the representative area of penetrated cells. The lower graph shows the average number of penetrated cells. The bars show the average values and S.D. of three independent experiments. *, significantly different from control at p < 0.05. D, upper panel shows the representative area of capillary tube formation by conditioned medium from control or MMP-13-depleted cells (×40). Capillary tube formation was examined as described in B. The lower graph shows the average capillary tube score after conditioned medium treatment. Capillary tube score was estimated with the Chalkley count method under a bright-field microscope. The values represent means of capillary tube score + S.D. based on three wells/data point in a single experiment. *, significantly different from control at p < 0.05.

