FIGURE 3.
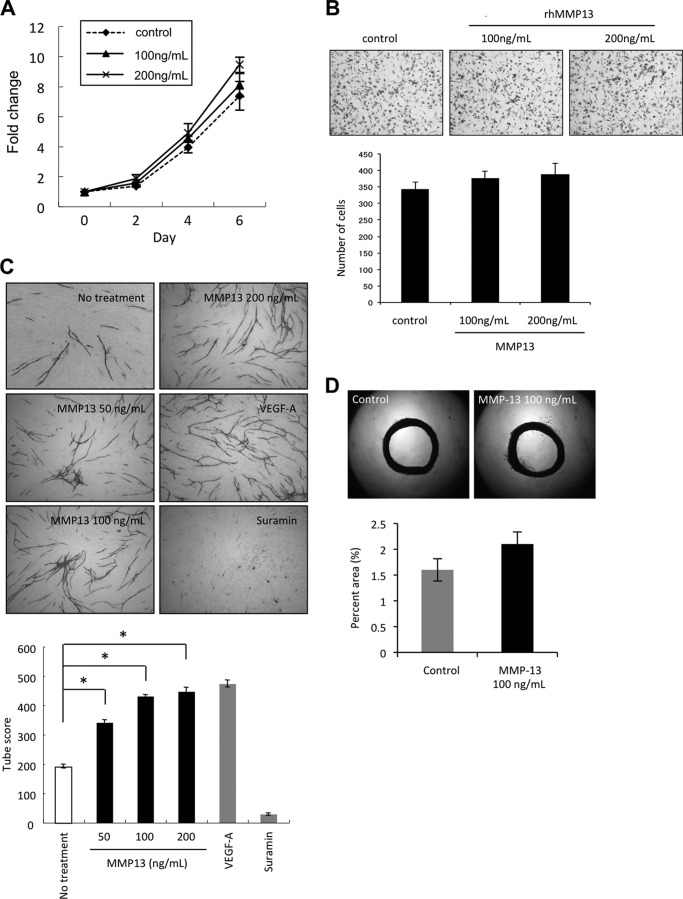
MMP-13 promoted angiogenesis both in vitro and in vivo. A, effect of MMP-13 on the proliferation of HuhT1 cells. Cells were plated on 24-well plates, and trypsinized cells were counted by Cell Counter at 0, 2, 4, and 6 days after adding recombinant MMP-13 protein (100 or 200 ng/ml). B, migration activity by recombinant MMP-13 protein. Migration activity was measured as described in Fig. 1E. The upper panel shows the representative area of penetrated cells. The lower graph shows the average number of penetrated cells. The bars show the average values and S.D. of three independent experiments. C, upper panel shows the representative area of capillary tube formation by treatment with recombinant MMP-13 protein (50, 100, and 200 ng/ml) (×40). VEGF-A (2 μg/ml) was used as a positive control, and suramin (1 mm) was used as a negative control. Capillary tube formation was examined as described in Fig. 1F. The lower graph shows the average capillary tube score after treatment with recombinant MMP-13 protein. The capillary tube score was estimated with the Chalkley count method under a bright-field microscope. The values represent means of capillary tube score + S.D. based on three wells/data point in a single experiment. *, p < 0.05. D, upper panel shows representative case of culturing aortic explants in three-dimensional matrix gels with or without recombinant MMP-13 protein (100 ng/ml). Excited thoracic aorta (1-mm-long cross-sections) was placed on the Matrigel-coated wells and covered with an additional 50 μl of Matrigel. Afterward, Control was treated with EBM-2 medium only or EBM-2 medium containing recombinant MMP-13 protein. Each medium was added every other day. All assays were performed by using five aortic rings per sample. Aortic rings were photographed on day 15. The area of angiogenic sprouting was calculated using Image-Pro Plus software program (Media Cybernetics). The lower graph shows microvessel densities in square pixels.

