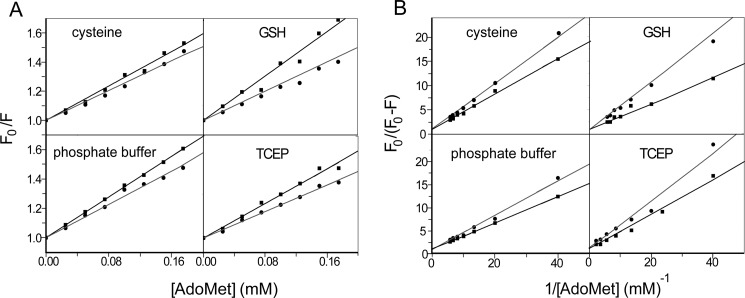
FIGURE 5.
A, the Stern-Volmer curves for the quenching of hAS3MT with AdoMet at 350 nm in different reductive systems (pH 7. 0) at 302.15 K (black line) and 310.15 K (gray line). B, the Lineweaver-Burk curves for the quenching of hAS3MT with AdoMet at the same conditions. The concentration of hAS3MT was 2.0 μm, and the concentrations of AdoMet were 0, 25, 50, 75, 100, 125, 150 and 175 μm, respectively. Each experiment was carried out three times.

