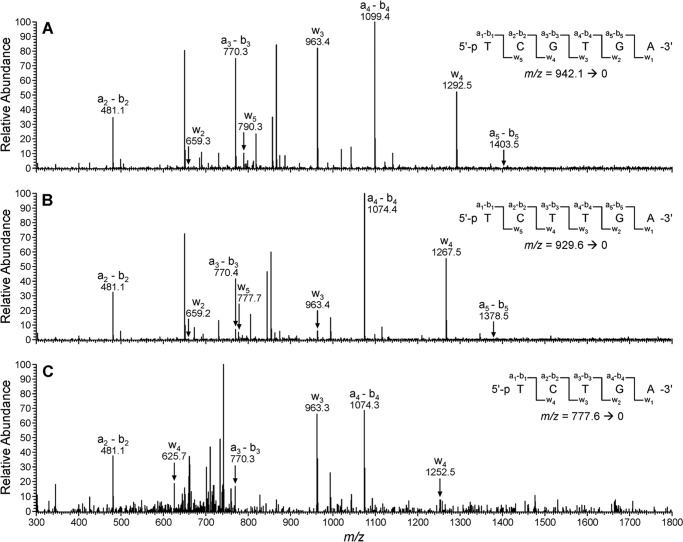
FIGURE 8.
CID spectra of the −1 and −2 deletion products observed following in vitro replication of 1,N6-γ-HMHP-dA-containing template by hpol κ. A, CID spectrum of the product 5′-pTCG_TGA-3′. B, CID spectrum of the extension product 5′-pTCT_TGA-3′. C, CID spectrum of the extension product 5′-pTC__TGA-3′.

