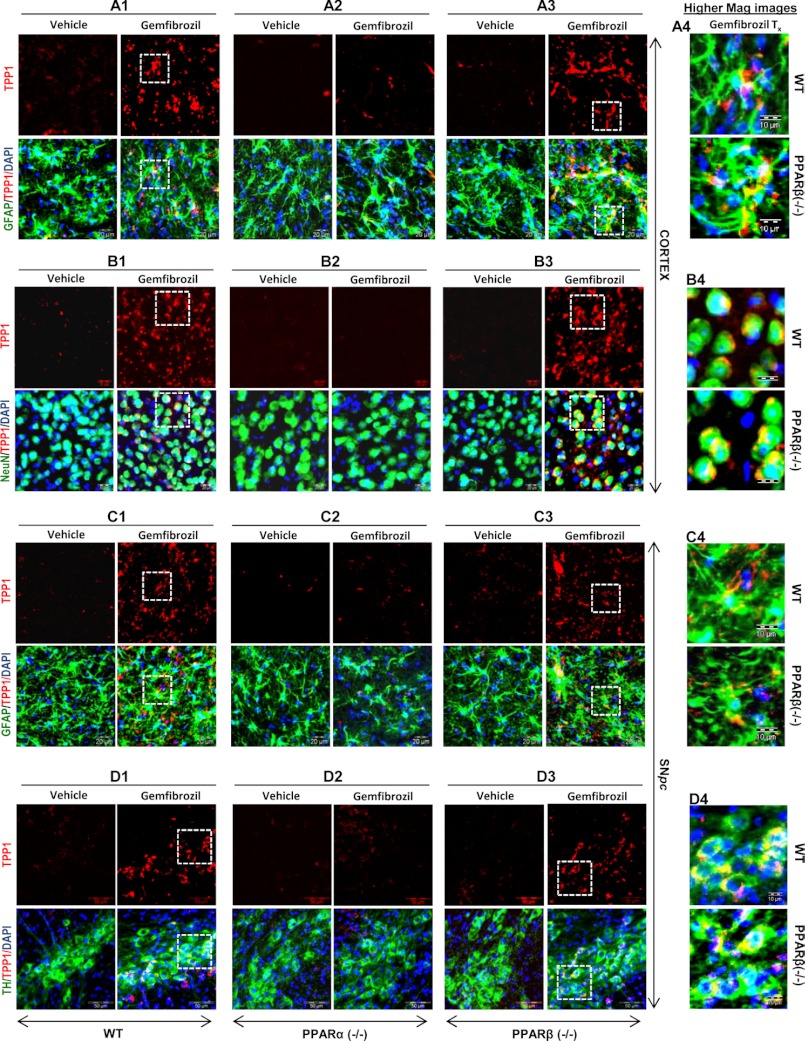
FIGURE 4.
Oral administration of gemfibrozil up-regulates TPP1 in vivo in cortical and nigral astrocytes and neurons of WT and PPARβ−/−, but not PPARα−/− mice. WT, PPARα−/−, and PPARβ−/− mice (n = 4 in each group) were treated with 7.5 mg/kg body weight/day gemfibrozil (dissolved in 0.1% methylcellulose) or vehicle (0.1% methylcellulose) via gavage. After 21 days of treatment, mice were killed, and cortical and nigral sections were double-labeled for TPP1 (red) along with either GFAP (green) or NeuN (green) or TH (green). DAPI was used to visualize the nucleus. A1–A3 and B1–B3, TPP1 levels were compared between the astrocytes and neurons of the cortical sections of vehicle-treated and gemfibrozil-treated (A1 and B1), WT (A2 and B2), PPARα−/− and PPARβ−/− (A3 and B3) mice. (A1–A3, GFAP and TPP1; B1–B3, NeuN and TPP1.) Scale bar, 20 μm. A4 and B4, higher magnification images showing co-localization of TPP1 and GFAP in the (A4) cortical astroglia and co-localization of NeuN and TPP1 in (B4) cortical neurons of gemfibrozil treated mice (WT and PPARβ−/−). Scale bar, 10 μm. C1–C3 and D1–D3, TPP1 levels were compared between the astrocytes and neurons of the nigral sections of vehicle treated and gemfibrozil treated (C1 and D1) WT, (C2 and D2) PPARα−/− & (C3 and D3) PPARβ−/− mice. Scale bar, 20 μm. (C1–C3, GFAP and TPP1; D1–D3, TH and TPP1). C4 and D4, higher magnification images showing co-localization of TPP1 and GFAP in the (C4) nigral astroglia and co-localization of TH and TPP1 in (D4) nigral TH neurons of gemfibrozil treated mice (WT and PPARβ−/−). Scale bar, 10 μm. All results represent analysis of each of three cortical and nigral sections of each of four different mice per group.

