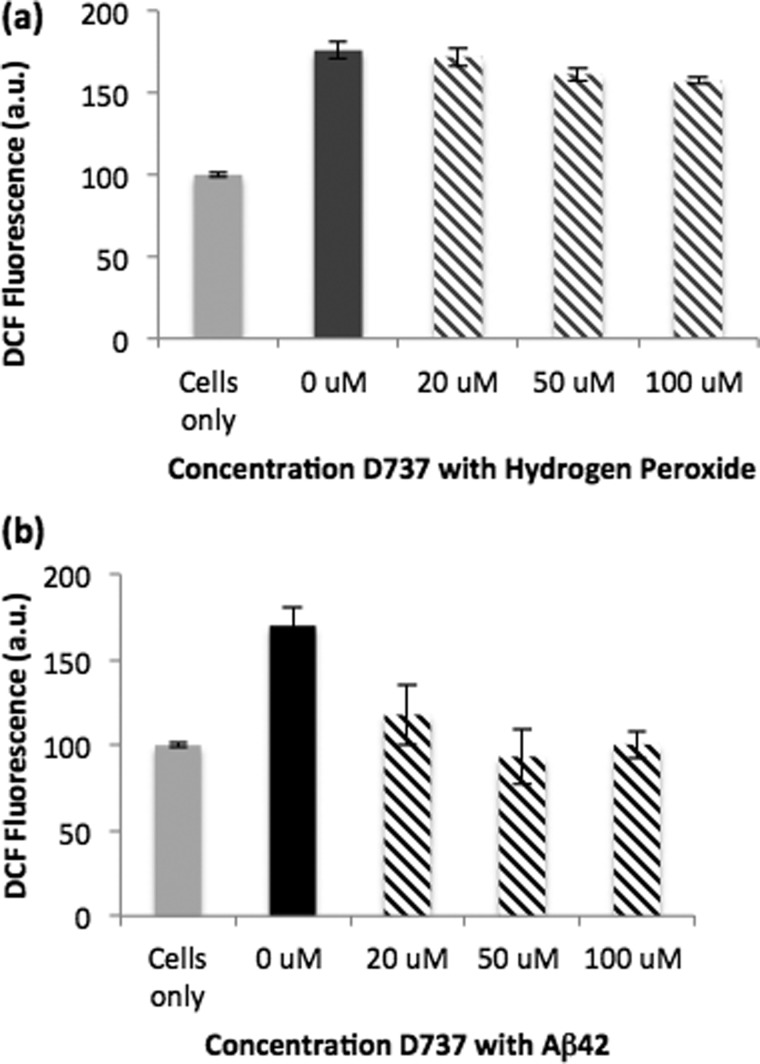
FIGURE 6.
Change in ROS accumulation in the presence of various concentrations of D737. DCF fluorescence of cells incubated with water as a positive control was normalized to 100% (light gray bars). DCF fluorescence above 100% indicates increased accumulation of ROS. a, D737 did not significantly affect ROS accumulation induced by hydrogen peroxide. PC12 cells were incubated for 24 h with 200 μm H2O2 (dark gray bar) or D737 and 200 μm H2O2 (hatched gray bar). b, D737 reduced the ROS accumulation induced by Aβ42. PC12 cells were incubated for 24 h with 20 μm Aβ42 (black bar) or Aβ42 and various concentrations of D737 (hatched black bars). a.u., absorbance units.

