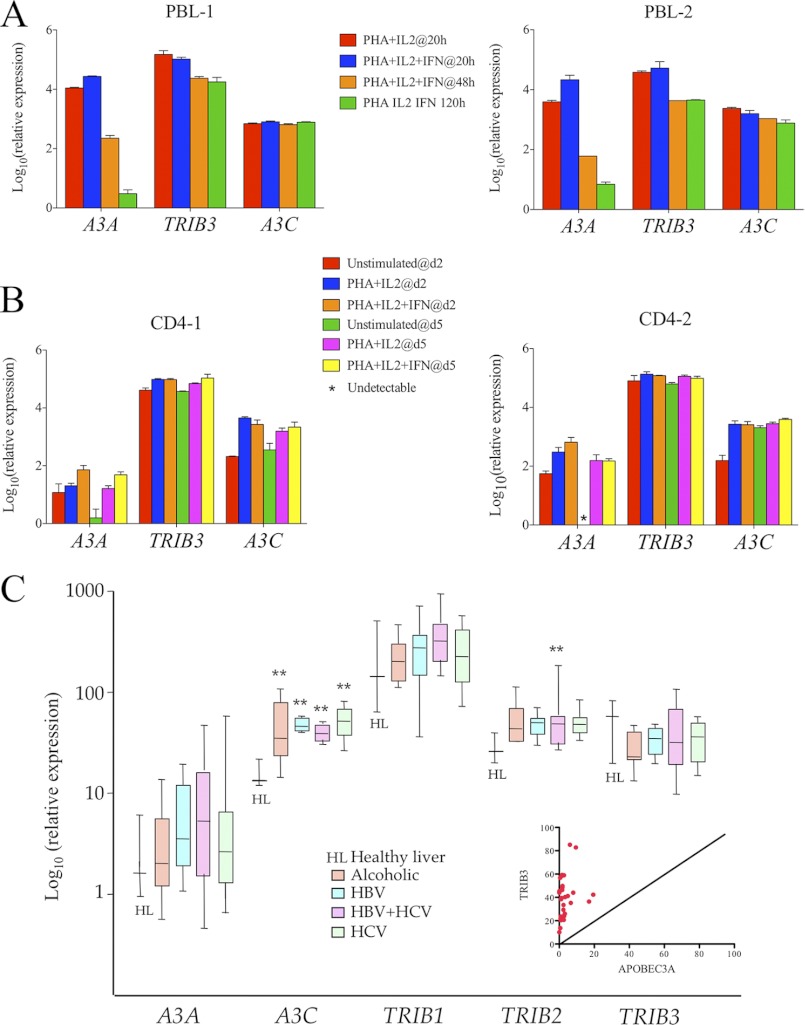
FIGURE 7.
Transcriptome analysis of A3A, A3C, and TRIB3 in hematopoietic cells and peritumoral cirrhotic tissues. A, TaqMan analysis of PBMC from two healthy donors at 20, 48, and 120 h after stimulation. B, TaqMan analysis of positively selected CD4+ T cells from two healthy donors at days 2 and 5. C, ABI chip analysis of A3A, A3C, TRIB1–3 in peritumoral tissues from patients with alcoholic, HBV-, HBV+hepatitic C virus (HCV)-, and HCV-associated cirrhosis. The inset gives paired A3A and TRIB3 levels from the same samples. **, statistically significant difference compared with healthy liver (p < 0.01). Expression levels are all normalized to RPL13A levels.

