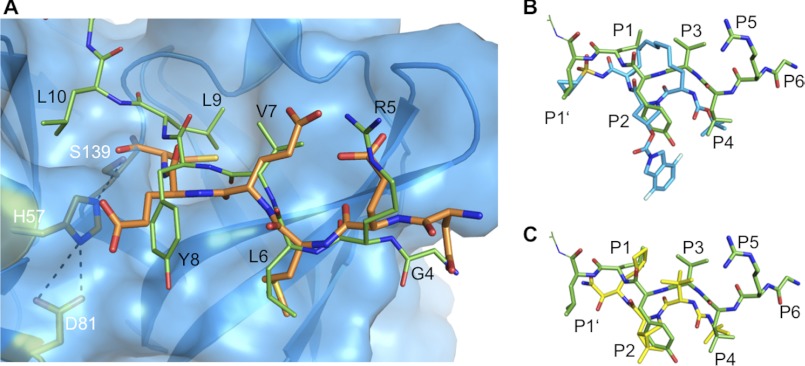
FIGURE 3.
Binding of peptide CP5-46-A to NS3-4A compared with the natural substrate and small molecule inhibitors. A, binding of CP5-46-A (green) compared with the natural substrate 4A5B (orange, PDB code 3M5M). NS3 protease domain is shown in blue with modeled surface and side chains of active site residues in orange. B, binding of CP5-46-A (green) compared with small molecule inhibitor ITMN-191 (blue, PDB code 3M5L). C, binding of CP5-46-A (green) compared with small molecule inhibitor boceprevir (yellow, PDB code 2OC8). The side chains binding to the protease subsites are indicated (P1′–P6). Structures were aligned based on NS3/4 backbone residues.

