
Figure 3.
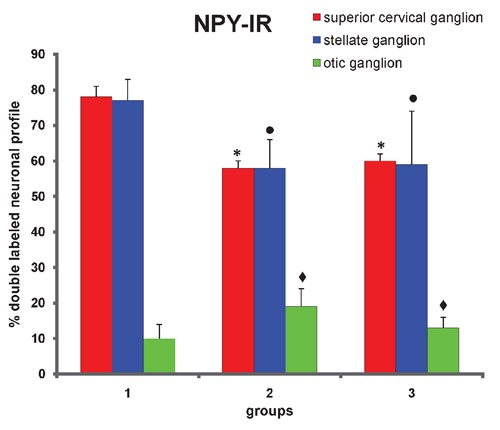
Proportion of NPY-IR nucleated neuronal profiles that innervate rat temporomandiular joint from superior cervical, stellate and otic ganglia. Group 1 represents animals with normal joint (normal group). Group 2 represents animals 48 hours after carrageenan deposition in joint (acute inflammation). Group 3 represents animals 15 days after carrageenan deposition in joint (chronic inflammation). Data are expressed as mean±SEM Kruskal-Wallis non-parametric ANOVA test and Dunn's multiple comparisons test were used to analyze differences between groups. Values of P<0.05 were considered significant. *control group vs chronic and acute inflammation groups, considering superior cervical ganglion, P<0.01. •control group vs chronic and acute inflammation groups, considering stellate ganglion, P<0.05. ✦control group vs chronic and acute inflammation groups, considering otic ganglion, P<0.05.