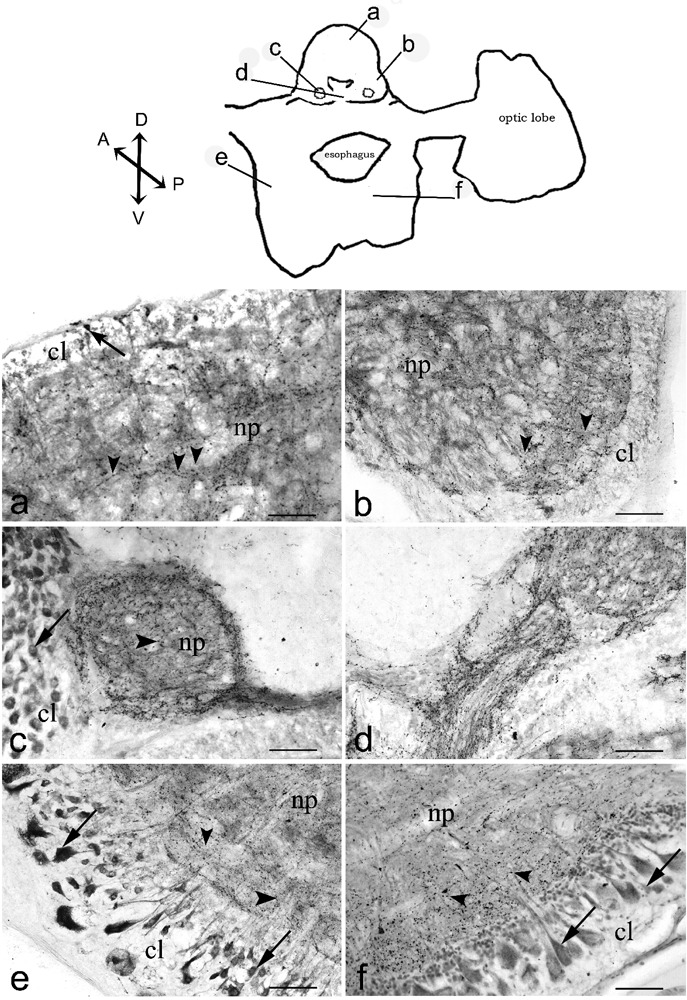
Figure 2.

cChAT imunoreactivity in the octopus supra- and subesophageal . The diagram of transverse section (obtained by camera lucida) show the locations of magnified photomicrograph: median superior frontal lobe (a), lateral superior frontal lobe (b), posterior buccal lobe (c), posterior buccal commissure (d), ventral magnocellular lobe (e), brachial lobe (f). Arrows and arrowheads indicate immunoreactive cells and immunoreactive nerve fibers, respectively. Scale bars: 100 µm. cl, cellular layer; np, neuropil. Axis: D, dorsal; V, ventral; A, anterior; P, posterior.
