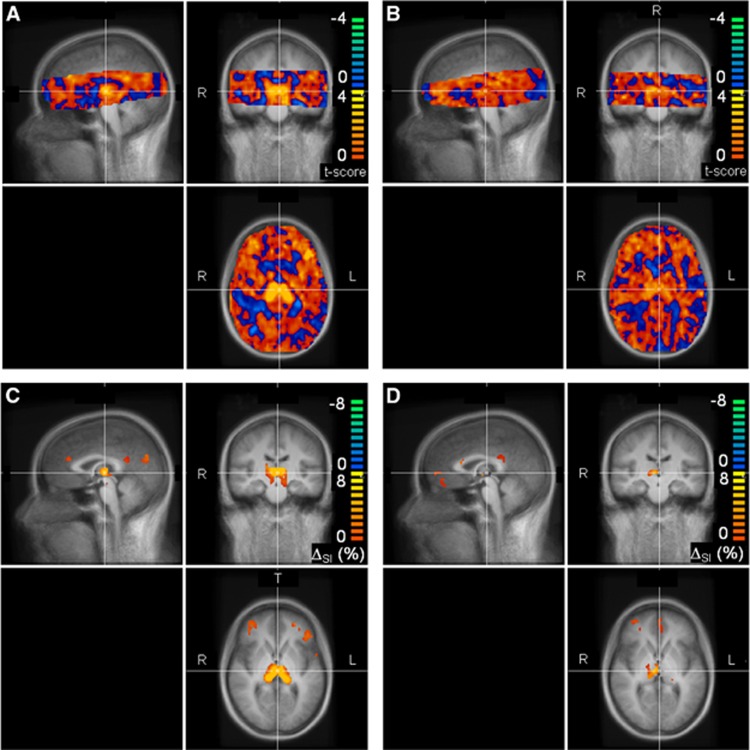
Figure 2.
Cerebral blood flow (CBF) responses to hypoglycemia (ΔSI (%)) in 12 healthy controls (A, C) and 11 hypoglycemia unaware subjects with type 1 diabetes (B, D). T-scores evaluating where ΔSI (%) differed from zero are shown in (A) and (B) for controls and diabetes patients, respectively. Only voxels common to all subjects and belonging to the brain are shown; red to yellow colors (blue to green colors) indicate larger (smaller) CBF in hypoglycemia versus euglycemia. Values of ΔSI (%) are displayed in (C) and (D) for controls and diabetes patients, respectively, only in those brain areas where differences occurred at a significance level of P<0.02, uncorrected for multiple comparisons. Maps in (A) to (D) are superimposed on the mean T1-weighted images of the Tailarach-normalized brain calculated from the 23 subjects. Sagittal, coronal, and transverse views are shown in the top left, top right, and bottom right section of each panel, respectively. SI, signal intensity.

