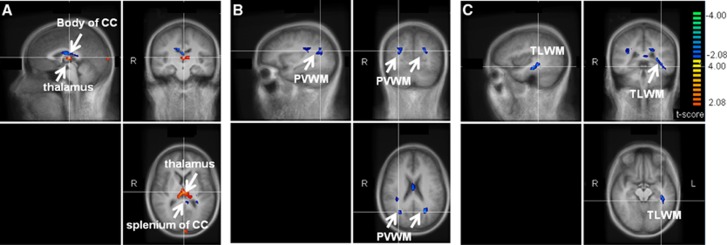
Figure 3.
Comparisons of ΔSI (%) induced by hypoglycemia in 12 healthy controls versus 11 hypoglycemia unaware subjects with type 1 diabetes, displayed on different brain sections (A to C). Images show the t-score maps calculated in the overlapping brain volume between controls and patients, as detailed in Figure 2. Parametric maps are superimposed on the mean T1-weighted images of the Tailarach-normalized brain calculated from the 23 subjects. Colors identify brain regions where the hypoglycemia-induced ΔSI (%) were different between controls and hypoglycemia unaware subjects with type 1 diabetes at a significance level of P<0.05, uncorrected for multiple comparisons. Red to yellow colors (blue to green colors) indicate larger (smaller) ΔSI (%) responses of controls as compared with patients. Sagittal, coronal, and transverse views are shown in the top left, top right, and bottom right section of each panel, respectively. R and L indicate right and left, respectively. While larger ΔSI (%) were observed in the thalamus of controls versus patients, smaller ΔSI (%) were observed in the splenium and body of the corpus callosum (CC), in the periventricular white matter (PVWM), and in temporal lobe white matter (TLWM). SI, signal intensity.

