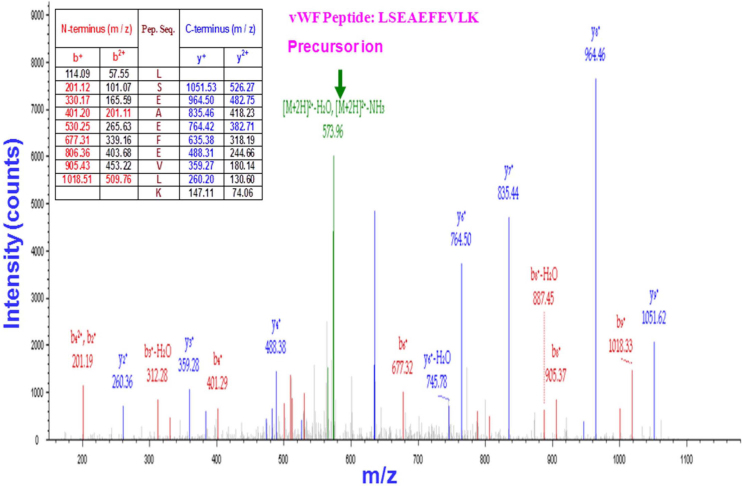
Figure 6. Proteomic analysis of vWF production by platelets.
After one-step iodixanol-gradient centrifugation, purified platelet fractions were collected and subjected to LC-MS/MS (LC-tandem mass spectrometry). The results are displayed graphically with the intensity expressed as the ion count (y-axis) and plotted against the m/z ratio of the ions (x-axis). The precursor ion-scan mass spectrum of the vWF tryptic digest resulted in an m/z of 573.96, as shown in green. The MS/MS product ion spectrum obtained from the fragmentation of this precursor ion at m/z 573·96 with b-ions (red peaks) and y-ions (blue peaks) corresponds to the sequence LSEAEFEVL from the tryptic vWF peptide LSEAEFEVLK, as shown in the table (inset). Six peptides matched the sequence of vWF. Each sample was subjected twice to LC-MS/MS.

