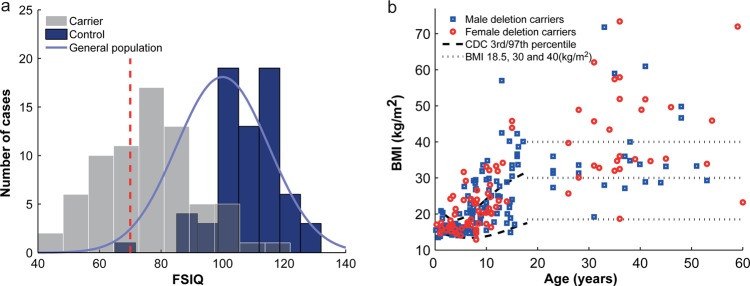
Figure 2.
Distribution of full scale intelligence quotient (FSIQ) and body mass index (BMI) in deletion carriers.(A) Distribution of FSIQ of 16p11.2 BP4-BP5 deletion carriers (grey bars), intrafamilial non-carrier relatives (control, blue bars) and general population (blue bell curve). The red dashed vertical line represents the FSIQ threshold (70) for intellectual disability (ID). FSIQ is on average 32 points lower in carriers (n=71; mean=76.1; SD=16.4) when compared to their relatives who did not carry the deletion (n=68; mean=108.3; SD=10.9). SD in carriers is similar to that of the reference population (mean=100; SD=15). Bin size was calculated to obtain 10 equal sized bins. (B) Cross-sectional distribution of BMI in carriers (circles: female; open squares: male). BMI progressively increases throughout childhood and adulthood. 70% of the adult carriers are obese (BMI ≥30). The dashed lines represent the 3rd and 97th Center for Disease Control and Prevention (CDC) centile, while the dotted lines pinpoint the thresholds for underweight (BMI=18.5), obesity (30), and morbid obesity (40).

