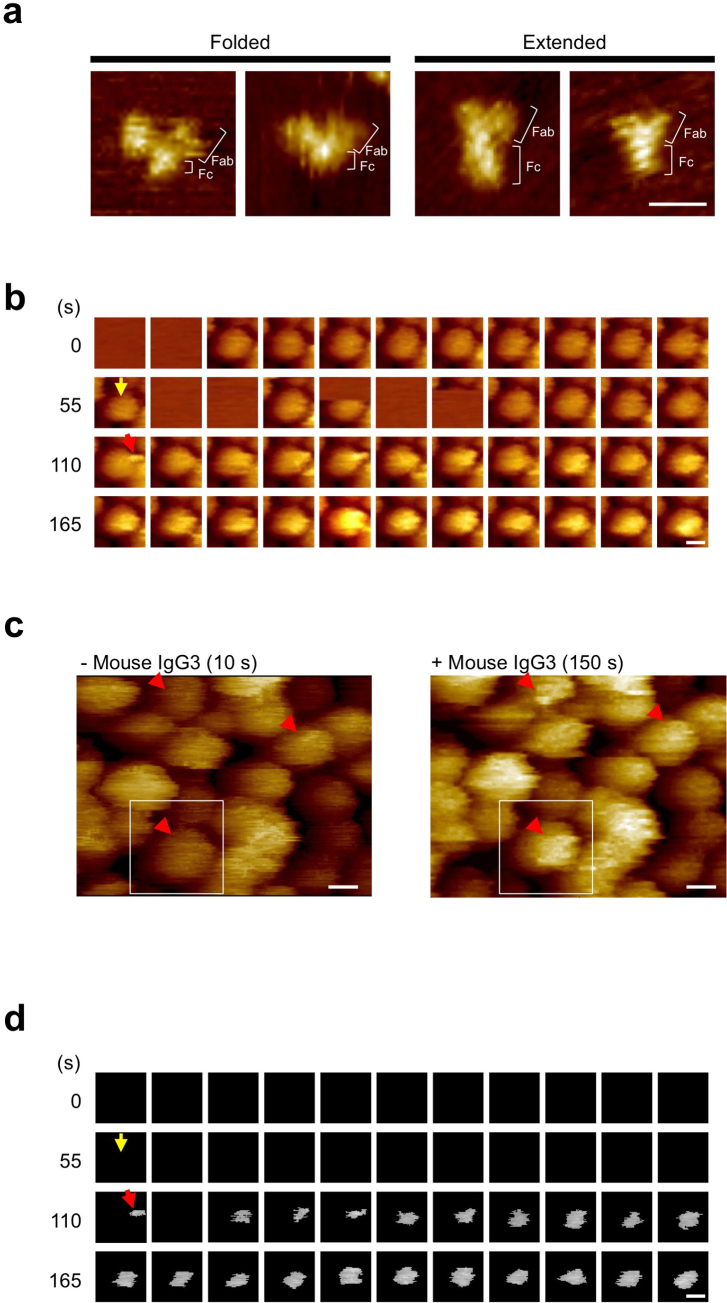
Figure 2. HS-AFM analyses of mouse IgG3 and ZZ-BNC in solution.
(a) HS-AFM images of mouse IgG3 molecules. Bar, 20 nm. (b) Video image of the movement of mouse IgG3 on ZZ-BNC (0.2 fps). Yellow arrow, the addition of mouse IgG3. Red arrow, first appearance of attachment. Times (s) after the start of observation are indicated in the left margin. Bar, 20 nm. (c) HS-AFM images of ZZ-BNCs on a gold surface without (10 s, left panel)/with (150 s, right panel) mouse IgG3. ZZ-BNC used for (b) is indicated by a white box. The locations where mouse IgG3 appeared are indicated by red arrowheads. Bars, 20 nm. (d) Binarized video image of the movement of mouse IgG3 on ZZ-BNC (0.2 fps). Yellow arrow, the addition of mouse IgG3. Red arrow, first appearance of mouse IgG3. Times (s) after the start of observation are indicated in the left margin. Bar, 20 nm.

