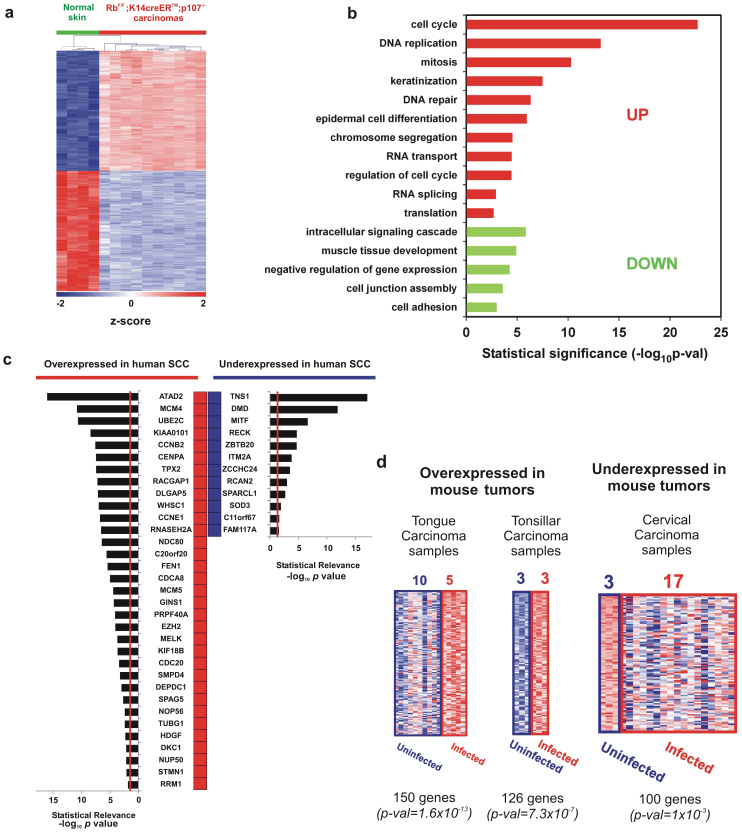
Figure 4. Genomic analysis of RbF/F;K14creERTM;p107−/− tumors.
a) Unsupervised hierarchical clustering of carcinomas using the 2256 deregulated probesets was done with Pearson distance metrics and complete linkage method. Columns represent samples, and rows are genes. Green samples are normal control skin from adult mice. Red samples are RbF/F;K14creERTM;p107−/− carcinomas. Z-scores in log2 scale were calculated for heatmap visualization. b) Enrichment analysis in Gene Ontology Biological Processes from the carcinoma signature of RbF/F;K14creERTM;p107−/− mouse. Red bars correspond to overexpressed genes and green bars correspond to downregulated genes p-val: significance of enrichment. c) Common gene signature between RbF/F;K14creERTM; p107−/− mouse and at least 7 out of 15 different human SCC studies (from lung, head and neck, skin, esophagus, and cervix) obtained from “Cancer vs. Normal” comparisons in Oncomine (see Supp Table S3 and S4). Red boxes represent human genes overexpressed in SCC compared with normal tissue. Blue boxes represent human genes underexpressed in SCC compared with normal tissue. Bar plots represent the significance of the overlap, being the provided p-val for each specific gene the median-ranked p-val in each comparison. Genes are ordered by significance. Vertical red lines in bar plots represent p-val = 0.025. d) Significant GE overlapping between RbF/F;K14creERTM;p107−/− mouse and human HPV-infected carcinoma samples were found for both over- (in red) and under-expressed (blue) genes in Oncomine. For RbF/F;K14creERTM;p107−/− carcinoma genes (columns represent human samples, and rows are genes) the heatmap, the number of uninfected/infected human samples analyzed, the number of common genes, and the significance of overlapping (p-val) are provided.

