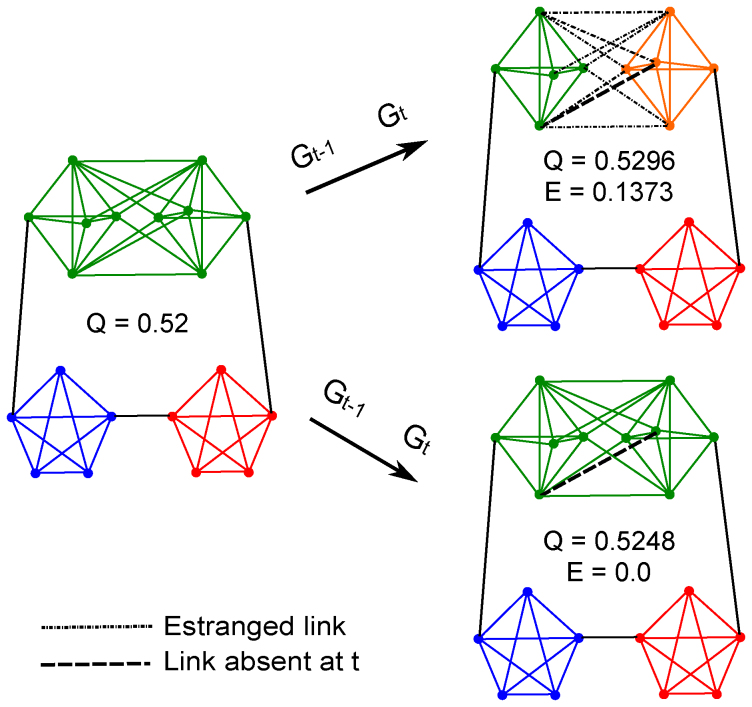
Figure 1. An example illustrating the detection of temporal communities via estrangement confinement.
The network on the left, Gt–1 consists of 20 nodes and 52 links, and a maximal modularity partition of this network consists of three communities represented by the three colors (Q = 0.52). In the next snapshot, the network has evolved to Gt which differs from Gt–1 only in the absence of a single link, indicated by the dotted line. The top right and bottom right networks both represent the same network Gt, but indicate distinct choices of community partitions available. The partition shown on the top right,  consists of 4 communities, and is the partition that gives the highest modularity
  . The partition
  for Gt shown on the bottom right which preserves the node partition chosen for Gt–1 has a slightly lower modularity of
  . The partition
  with higher modularity, however, makes 7 links estranged. The estranged links (shown in gray) are those intra-community links at t – 1 that change to inter-community links at t. Notice that links in the orange community of
  despite having changed their community affiliation from t – 1 to t are not estranged since they are still intra-community links. In contrast to
  , the partition
  yields no estranged links. Estrangement, E, defined as the fraction of estranged links at t is therefore 0 for
  but 7/51 = 0.13 for
  . Maximizing modularity while constraining estrangement to a low value (e.g. 0.05) therefore yields
  as the partition for Gt, yielding a smoother temporal progression of the community structure from t – 1 to t.

