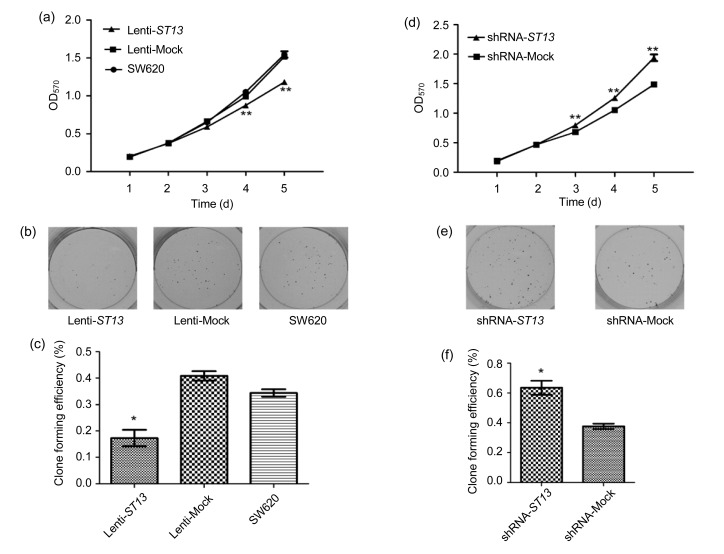
Fig. 2.
Effect of ST13 expression on SW620 cell growth in vitro
(a) Effect of ST13 overexpression on SW620 cell proliferation determined by MTT assay. Error bars indicate SEM (n=3 experiments). ** P<0.01, Lenti-ST13 vs. Lenti-Mock and SW620 (one way ANOVA and Dunnett’s test). (b) Colony formations of Lenti-ST13, Lenti-Mock, and SW620 cells in vitro. (c) Quantitative analyses of colony formations of Lenti-ST13, Lenti-Mock, and SW620 groups. Error bars indicate SEM (n=3 experiments). * P<0.05, Lenti-ST13 vs. Lenti-Mock and SW620 (one way ANOVA and Dunnett’s test). (d) Effect of ST13 knockdown on SW620 cell proliferation determined by MTT assay. Error bars indicate SEM (n=3 experiments). ** P<0.01, shRNA-ST13 vs. shRNA-Mock (Student’s t-test). (e) Colony formations of shRNA-ST13 and shRNA-Mock cells. (f) Quantitative analyses of colony formations of shRNA-ST13 and shRNA-Mock groups. Error bars indicate SEM (n=3 experiments). * P<0.05 shRNA-ST13 vs. shRNA-Mock (Student’s t-test)

