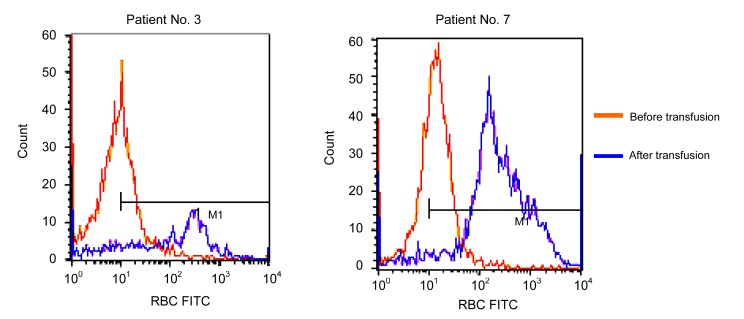
Fig. 1.
Flow cytometry analysis of anti-D before and after transfusion
The fluorescein isothiocyanate (FITC) intensities of pre-transfusion and post-transfusion anti-D to D-positive red cells were compared. In patient No. 3, the mean fluorescence intensity and the peak fluorescence intensity before transfusion were 10.22 and 14.28, respectively. Both values after transfusion were 224.74 and 317.54. In patient No. 7, the values were 11.56 and 19.38 pre-transfusion, and 315.35 and 233.26 post-transfusion, respectively

