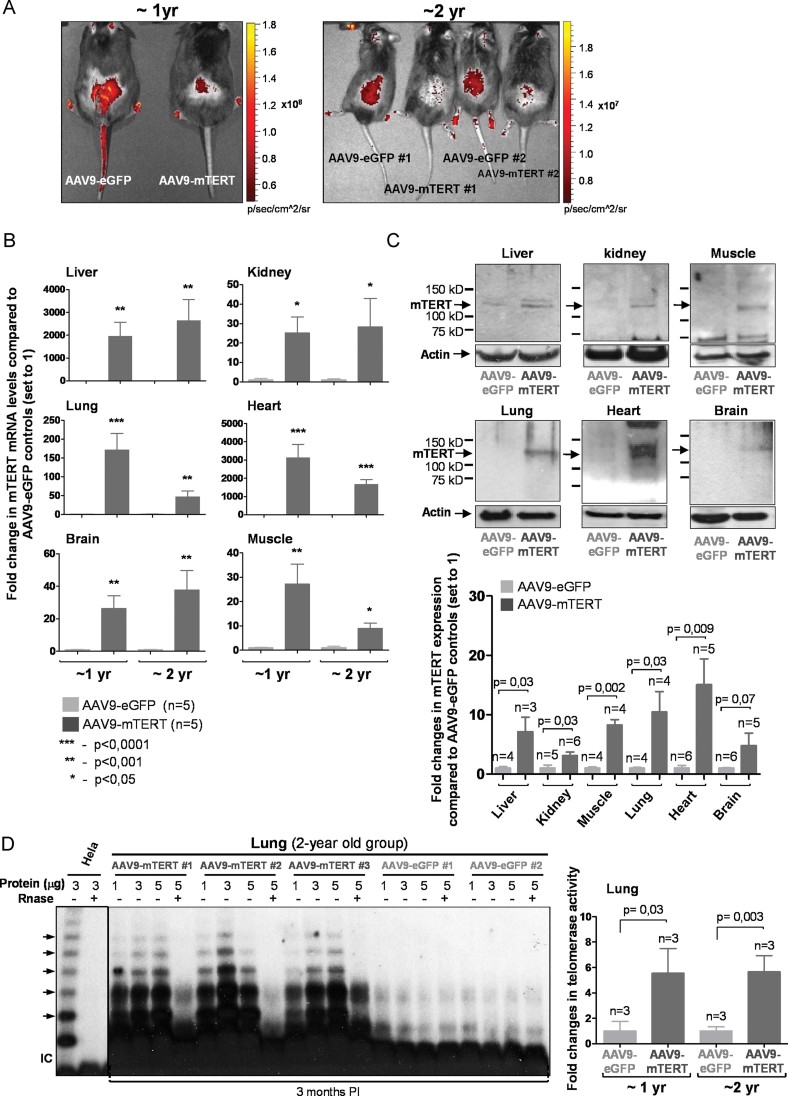
Figure 1. AAV9-mediated mTERT expression.
- Direct GFP fluorescence in shaved back skin of mice treated with the indicated vectors.
- Dark grey bars: fold change in mean ± SEM mTERT mRNA levels in AAV9-mTERT treated mice compared to AAV9-eGFP controls; light grey bars represent mean ± SEM after setting to 1 the control mice. mTERT mRNA values are normalized to actin. At least 5 male mice per group were used. Student's t-test was used for statistical analysis.
- TERT Western blots of tissue whole extracts from the 1 year-old group. Top, representative Western blot. Bottom, quantification of mTERT protein from 3 to 6 male mice. Values are normalized to actin. Student's t-test was used for statistical analysis. Data are given as mean ± SD. Molecular weight markers are shown. Controls for TERT antibody are shown in Supporting Information Fig S2.
- Telomerase activity (measured through TRAP assay) in several tissues from either AAV9-eGFP or AAV9-mTERT injected mice.

