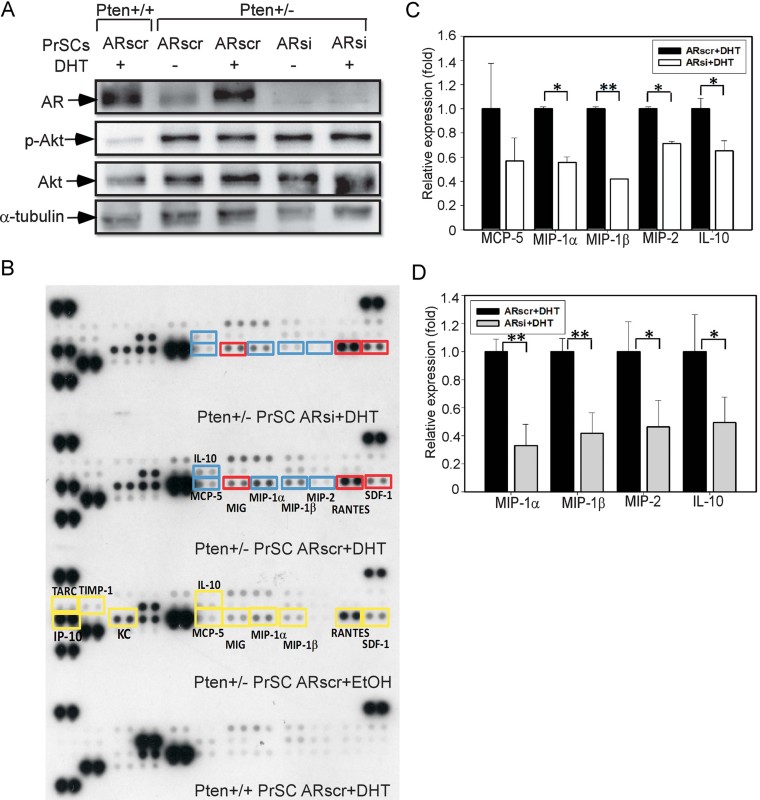
Figure 5. Stromal fibromuscular AR controls pro-inflammatory cytokines/chemokines expression.
- Primary cultures of PrSCs from 22 to 24-week-old Pten+/− mouse DLPs were prepared and lentivirus carrying AR siRNA was used to knockdown AR. The AR scramble (ARscr) and ARsiRNA (ARsi) knockdown cells were then treated with EtOH or 10 nM DHT after following by immunoblotting against AR, p-Akt (at Ser 473), total Akt and α-tubulin. The stromal cell pools came from 5 to 6 mice.
- The ARscr or ARsi PrSCs were cultured with 10% CD-FBS medium for 2 days and then stimulated with EtOH or 10 nM DHT for another 1 day. The CM were collected and subjected to a pro-inflammatory cytokine array analysis according to the manufacturer's instructions. The yellow boxes indicate the cytokines that were increased in the Pten+/− PrSCs ARscr + EtOH or Pten+/− PrSCs ARscr + DHT group as compared to Pten+/+ PrSCs ARscr + DHT. The blue boxes indicate the reduction of cytokine level in Pten+/− PrSCs ARsi + DHT as compared to Pten+/− PrSCs ARscr + DHT. The red boxes indicate the elevation of cytokine level in Pten+/− PrSCs ARsi + DHT as compared to Pten+/− PrSCs ARscr + DHT. The primary PrSCs were pooled and collected from 5 to 6 mouse DLPs.
- Dot quantification results were determined using Biorad ChemiDoc™ XRS+ System. Each bar represents the mean ± SD of at least two dependent determinations performed in triplicate.
- Real-time PCR analysis was used to validate the cytokine changes in Pten+/− PrSCs ARscr and Pten+/− PrSCs ARsi in the presence of 10 nM DHT. Each bar represents the mean ± SD of at least two-independent determinations performed in triplicate.

