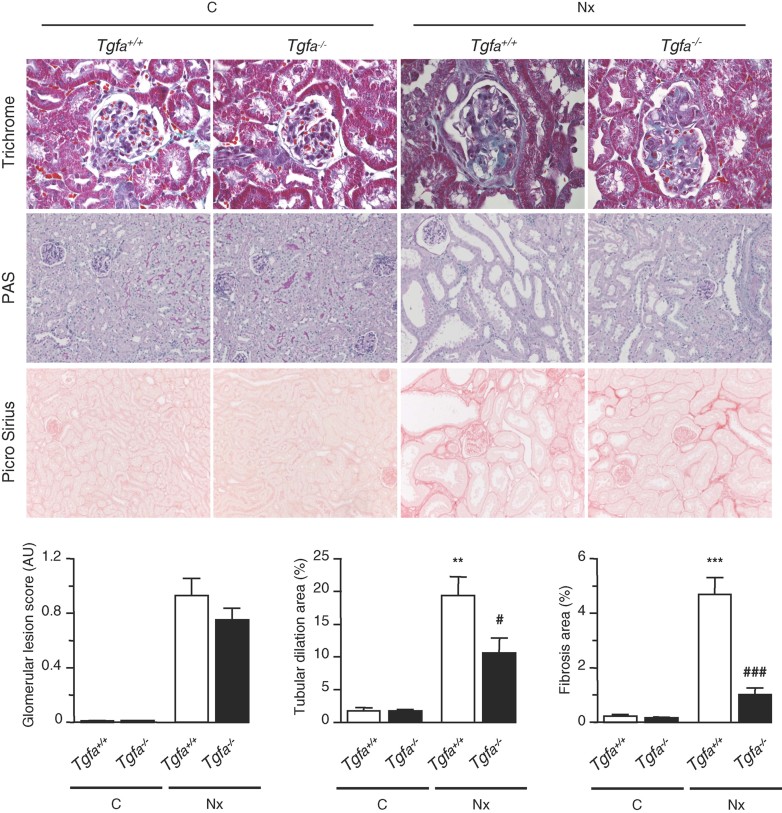
Figure 7. Tgfa deficiency prevents tubulo-interstitial lesions in FVB/N mice.
Morphology and lesion scores of kidneys from control (C) and 75% nephrectomized (Nx) Tgfa+/+ and Tgfa−/− mice, 2 months after surgery. Magnification: X600 and X200 for glomerular and tubular/interstitial lesions, respectively. Data are means ± SEM; n = 6–10. Statistical analysis: ANOVA, followed by Tukey–Kramer test (n = 6 for C and n = 10 for Nx)): Nx versus control: **p < 0.01, ***p < 0.001; Tgfa−/− versus Tgfa+/+ #p < 0.05, ###p < 0.001.

