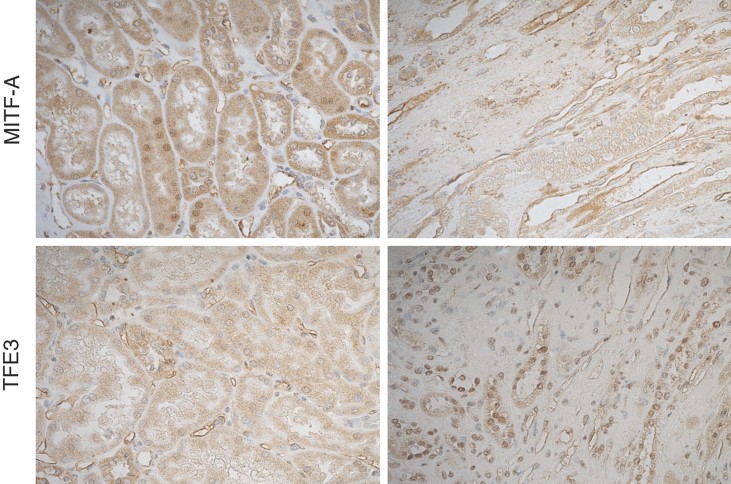
Figure 8. MITF-A and TEF3 expression in kidney transplant recipients.
MITF-A (upper panels) and TFE3 (lower panels) staining in kidneys of two groups of patients, one with normal morphology (left panel) and the other one with severe tubulo-interstitial lesions (right panel). Of note, whereas MITF-A was detectable in nuclei of kidneys with normal morphology, TEF3 could be detected mainly in nuclei of kidneys with severe renal lesions. Pictures are representative samples of 12 patients for each group.

