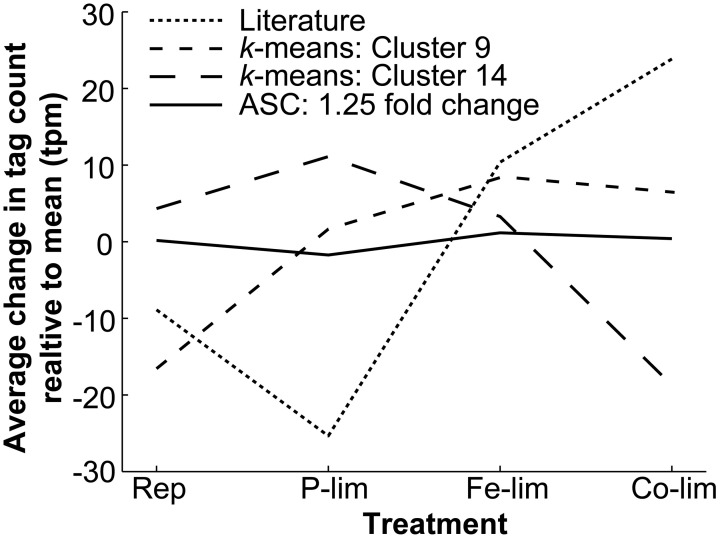
Figure 2.
Average deviation from the mean level of expression for all genes found with literature-based searches, k-means clustering, and ASC analysis of 1.25 fold change. The average change in tag count from the mean expression (tpm) for all the genes identified through literature-based searches for genes homologous to known reference genes from the literature (n = 101), k-means clustering from Cluster 9 (n = 243) and Cluster 14 (n = 466), and ASC analysis identifying genes demonstrating a 1.25 fold change with a post-p < 0.1 (n = 179). The mean standard deviations for the four cases are as follows: Literature (92.62 tpm), Cluster 9 (41.66 tpm), Cluster 14 (43.12 tpm), and ASC (14.24 tpm). The mean tpm is plotted for the four treatments: Replete (Rep), P-limited (P-lim), Fe-limited (Fe-lim), and Co-limited (Co-lim).

