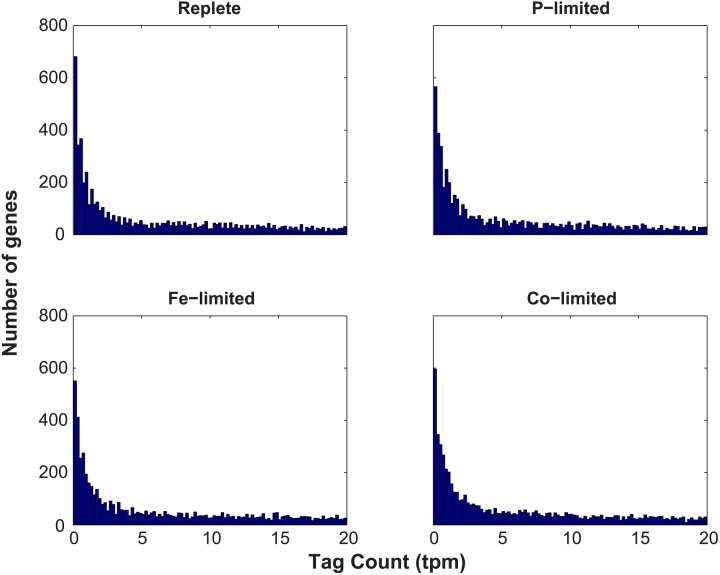
Figure A1.
Histogram analysis of the distribution of normalized tag counts (tpm) for each gene across each of the four treatments (Replete, P-limited, Fe-limited, and Co-limited). The abundance of normalized tag counts (tpm) was assessed, tallying the total number of genes with a given tag count. Only tag counts less than 20 are depicted to aid the visualization of the inflection in the data at 2.5 tpm.

