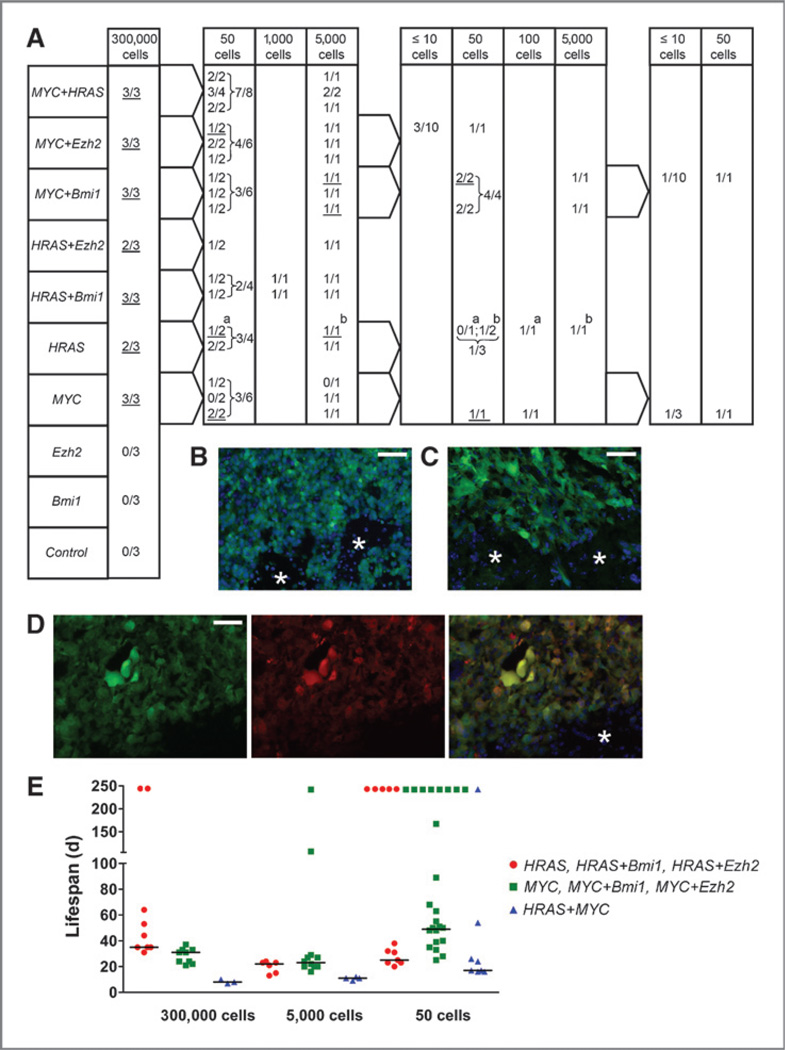
Figure 1.
Serial intracranial transplantations of p53−/− NSC/NPCs expressing different genes (MYC, HRAS, Bmi1, and Ezh2) and of eGFP control cells. A, primary to quaternary transplantations from left to right. The number of mice with tumors/number of transplanted mice is shown. Cells from underlined tumors were FACS isolated and used in subsequent transplantations. For example, 3 of 3 mice transplanted with 300,000 MYC overexpressing cells developed tumors. A total of 50 cells from each of the 3 tumors were transplanted into 2 recipient mice and 5,000 cells from each tumor into one animal. Both animals that received 50 cells from the third primary tumor developed tumors, and cells from one of these 50 cell tumors (underlined) were further transplanted into tertiary recipients: one animal received 50 and another 100 cells. Both animals developed tumors, and cells from the first one (underlined) were used in quarternary transplantations (3 mice receiving 10 cells or less and one animal receiving 50 cells). In all cases, except for the one in which tumors are marked with a and b, only one tumor sample of each genetic type was used for subsequent transplantations. Cryosections of secondary tumors from cells overexpressing MYC (B), HRAS (C), and MYC together with HRAS (D) showing green (B, C) or green and red fluorescent tumor cells (D). Asterisk, adjacent normal tissue; scale bars, 50 µm. E, life span of tumor-bearing mice (in days) from primary to quaternary transplantations. Tumors are grouped according to their histology: gliomas (red dots),CNSPNETs (green squares), AT/RT-like (blue triangles). Horizontal lines: median lifespan values of animals that developed tumors (from left to right: 35,31,8/22,23,11/25,49,17). Animals that were alive after 244 days were not included in the calculation and are indicated on top.

