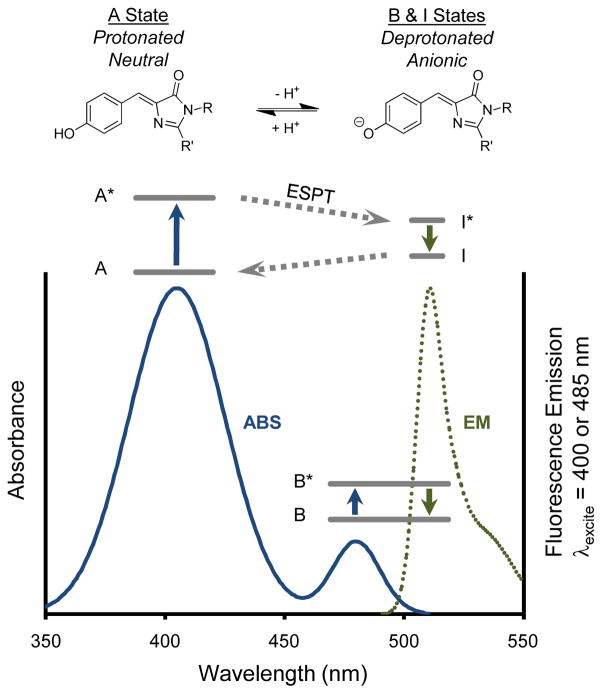
Figure 3.
Protonation of the fluorescent protein chromophore and its effects on the absorbance and fluorescence spectra. The example is theoretical but based on the wild type green fluorescent protein chromophore and spectra. In the physiological pH range, the chromophore can be protonated in a neutral “A” state or ionized in an anionic “B” state (top). Two peaks in the absorbance spectrum (solid blue curve) reflect the two states. A single peak is observed in the fluorescence emission spectrum (dotted green curve) when exciting the B state, and a similar emission spectrum is observed when exciting the A state because excited-state proton transfer occurs, creating an anionic excited state I* very similar to the B* anionic excited state. Simplified Jablonski diagrams are superimposed to represent energy transitions following absorption (blue arrow) and resulting in fluorescence emission (green arrow). The B and B* energy levels are shown lower in the diagram for visual clarity and are not indicative of actual energy differences with the A or I states.

