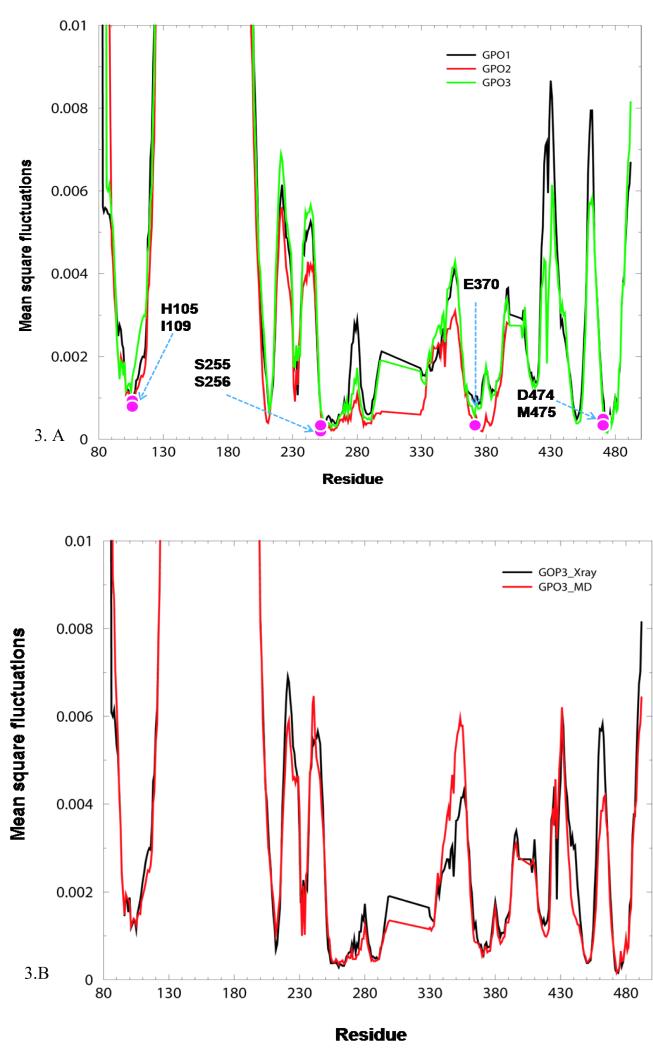
Figure 3.
A. Mean square fluctuations from GNM slow modes. Mean square fluctuations calculated from the average of the two slowest, most cooperative GNM slow modes (2,<k,<3), considering only the GP120 core, for GPO1 (black curve), GP02 (red curve) and GPO3 (green curve). Pink balls indicate residues that display GNM slow mode minima and are less the 4.5 Å from W427
B. Comparison of GNM Slow mode profiles for X-ray and MD snapshot. Mean square fluctuation of the X-ray structure (black curve) and the MD structure averaged over 5ns for GPO3 (red curve).

